
Rolldown
A dispatch from the number crunchers – Yield curve rolldown
By Matthew Russell
15 April 2026

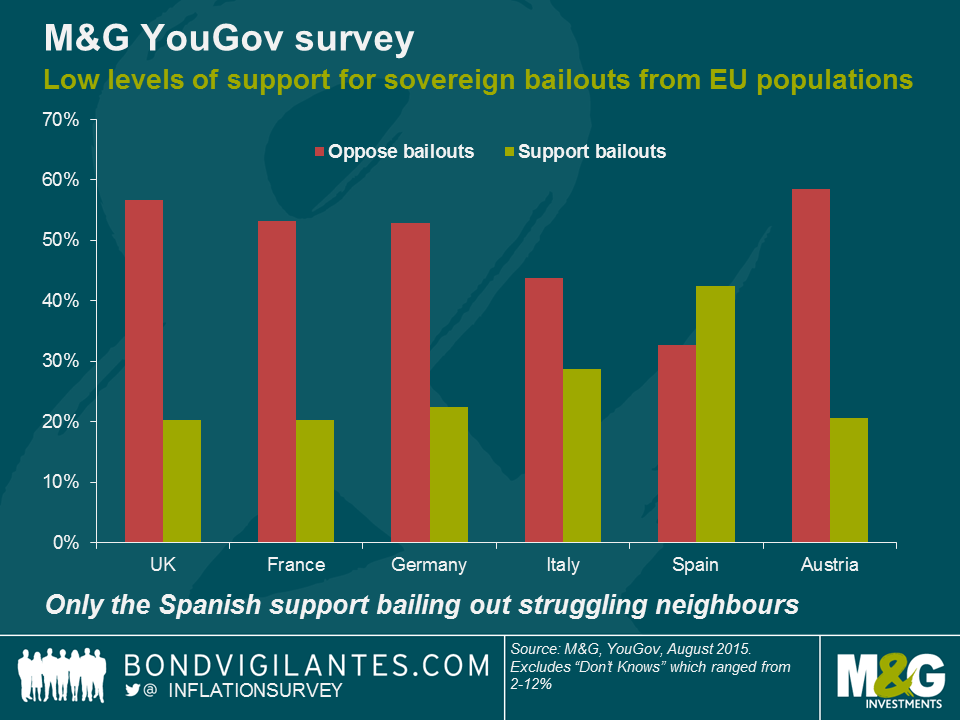
Our new survey, carried out with YouGov across several EU member states (the UK, France, Germany, Italy, Spain and Austria), shows that there is a low level of support for future sovereign bailouts in the event of debt crises and economic difficulties. The following question was asked as part of the M&G YouGov Inflation Expectations Survey – the full survey will be released here in early October.
To what extent would you support or oppose (your country) providing significant financial support (or writing off some or all of the money owed to your country) in the event that another European Union nation got into serious economic difficulties?
As you might expect, the UK where anti-Europe party UKIP won 13% of the vote in the general election and where a Brexit referendum is planned to take place by the end of 2017, has a high level of opposition to sovereign bailouts funded by British taxpayers. However the strongest opposition to sovereign bailouts within the European Union was found in Austria, and both France and Germany also had a majority of respondents opposed to the concept. The two nations surveyed with the highest sovereign debt burdens, Italy and Spain, were unsurprisingly more supportive of helping countries in economic difficulties – and in the case of Spain 43% of respondents supported bailouts (by far the highest percentage), with the lowest percentage opposing them (33%). These data exclude “don’t knows” which ranged from just 2% in Austria to 12% in the UK. The balance of respondents in each case (not shown on the chart) replied that they “neither support nor oppose” the idea of bailouts.
To become an Optimum Currency Region, the Eurozone needs fiscal transfers between areas doing well, and areas where the economy is weak. The survey data confirm that the majority of the public do not support such transfers. This is perhaps no surprise – we blogged a couple of years ago that some German states are vehemently against fiscal transfers even within Germany itself, let alone to other EU members. The lack of public support does not mean that there can be no bailouts – we’ve already had sovereign bailout programmes within the EU. But it does mean that they lack democratic support and perhaps also that political parties that reflect the anti-bailout views of voters are likely to do well in the future. It also means that the agents for future bailouts are likely to remain institutions one step removed from the democratic process, such as the ECB and the IMF. And whilst we can look at these results and tell ourselves that they are an indication that the European project is flawed and broken, we should ask ourselves how Californians would vote if they had a choice about fiscal transfers to Detroit, or if the UK’s Home Counties were asked if they wanted to continue redistributing tax revenues to former industrial areas elsewhere in the country. But in the absence of a mechanism (or desire) for significant fiscal transfers within the EU, and the lack of a common language (although English is perhaps increasingly performing this role) restricting freedom of movement, it will be left to internal devaluations to make relative adjustments in the Eurozone, and this means periodic episodes of deflation, falling wages and high unemployment. Not optimum.
You can find the full details of this survey, and our other questions including those on inflation expectations, central bank and government credibility, and house price expectations when our M&G YouGov Inflation Expectations survey is released in October. Follow us for the first release of the data on @inflationsurvey and see https://bondvigilantes.com/inflation-survey/ for previous results.
This morning CPI in the UK has fallen from 0.1% in July to 0% in August, both in year-over-year terms. Continuing deflationary trends observed in transport (largely petrol) and food (supermarket price wars), which have together taken 0.7% off CPI over the last year, were dragged back up to the zero bound by alcohol and tobacco (these always go up!), education and restaurants and hotels, with smaller positive contributions from most other categories.
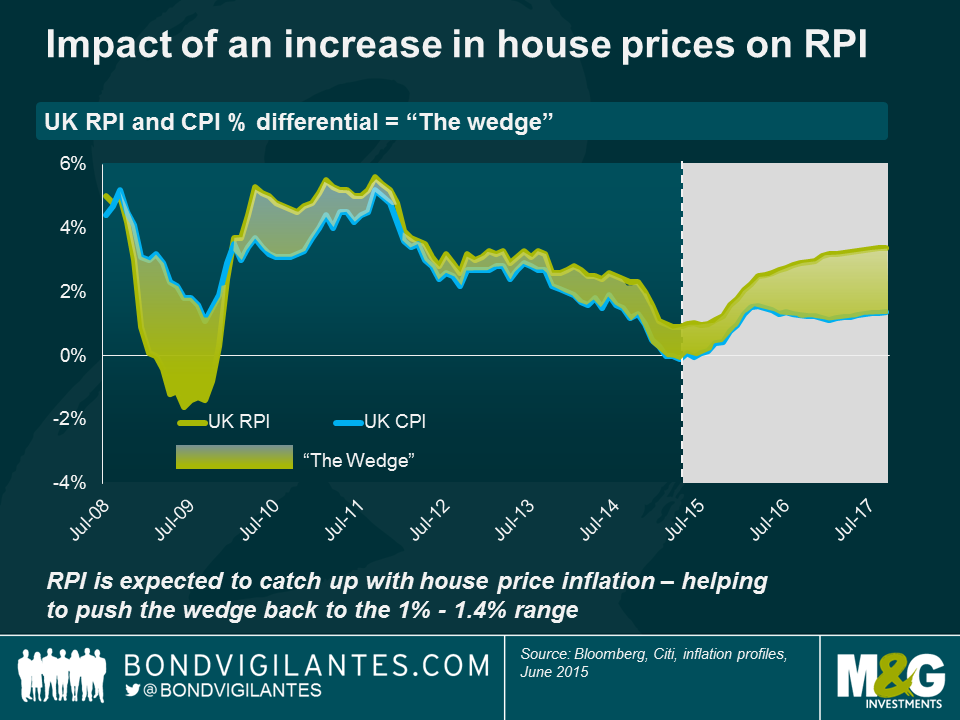
RPI, though, increased from 1.0% to 1.1%, and with CPI at 0%, this sees the ‘wedge’ increase to 1.1%, above the widely perceived fair value of 0.8% to 1%. UK index linked bonds pay inflation linked to RPI, and so holders of linkers are not experiencing noflation or deflation. In fact, several commentators are forecasting this wedge to grow to 1.5% next year, owing to the usual suspects of the formula effect (arithmetic vs geometric mean calculations), the constituent effect (the baskets contain different weights of different items), and in particular the housing market effect. RPI includes house prices and mortgage interest payments, which CPI does not. With house prices seemingly on the up, and with interests surely more likely to go up than down, these two factors could push the wedge beyond fair value, a positive for holders of UK linkers.
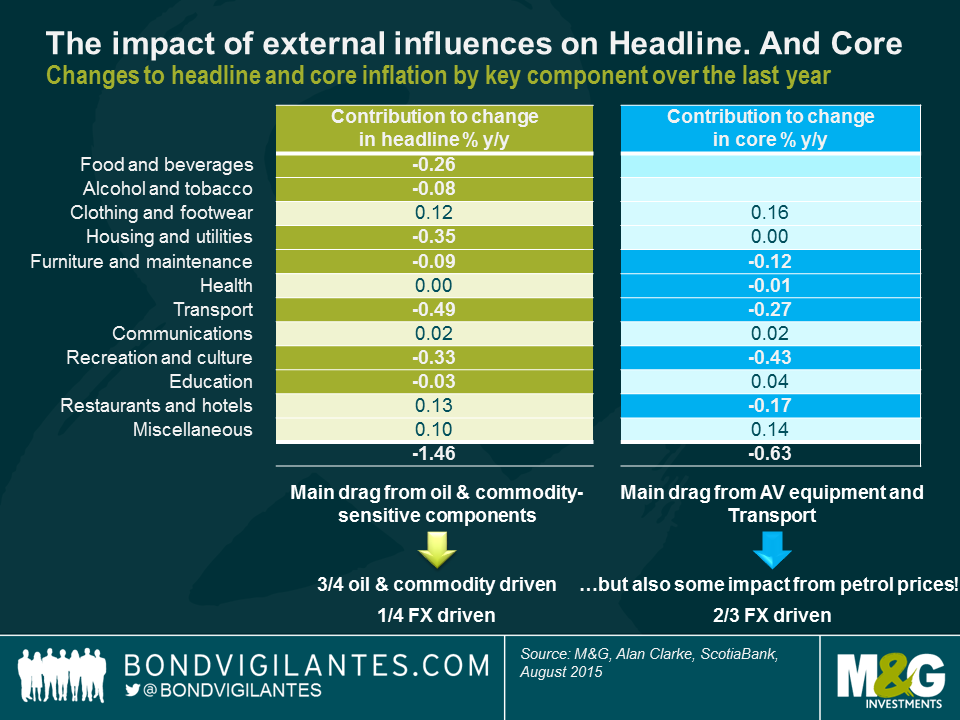
Over the last 12 months CPI has fallen by 1.5%, again largely driven by food, utility bills and transport. Core CPI has fallen by 0.6%, largely driven by used car prices and recreation and culture, particularly audio visual equipment. Essentially, headline CPI is being hit by energy and commodity prices (c.75%) as well as the strong pound (c.25%), whilst core CPI is being mainly dragged down by the strength of sterling. Core CPI strips out the volatile items of energy, commodities and food. But is the strength of sterling to be viewed as a non-transient and non-volatile driver of core inflation?
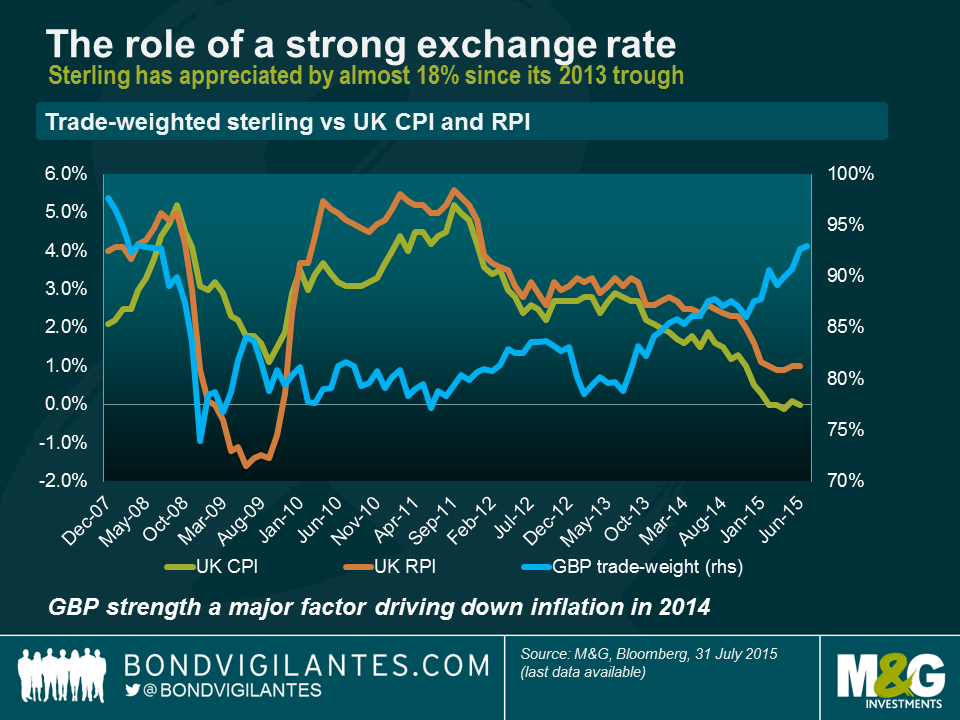
In actual fact, every good, wherever it’s made, needs to get from its point of manufacture to the shop shelf, so transport costs are going to be a major driver of the prices of goods that make it into core inflation numbers. In other words, core inflation is not as core as we may think. But on top of that, sterling’s 20% appreciation in trade weighted terms over the last two years has impacted the prices of the goods that we import. If you look at inflation numbers and trade weighted sterling since the on-set of the financial crisis, one could make a convincing argument that the currency is a volatile, non-core driver. Speaking to Alan Clarke of Scotiabank recently, he stated that there is a 10:1 passthrough from £ into CPI, so this has contributed -2% to CPI over the last 2 years.
If, like me, you treat the currency with caution, then you could make the case that true core CPI has been meaningfully higher over the last two years. Goods make up c.50% of CPI, so perhaps core CPI today is closer to 2% than the 1% we saw in today’s numbers? If you disagree with the notion that the currency is a volatile non-core item, then perhaps you should ask yourself whether you think the pound is likely to remain as strong as it is today. The UK’s current account deficit is greater today than it was before the IMF bailout in the 1970s and before the exit of the ERM in the early 1990s. That’s worth thinking about, in my mind.
So, inflation numbers are being battered by global energy and commodity prices at the headline level, and by the strength of the pound, particularly in core terms. But perhaps core CPI is not truly stating the underlying, domestically generated inflation picture in the UK. Services inflation is running at 2.3%, and the UK is a services driven economy. The labour market has tightened significantly, and wages are showing solid signs of being on an upward path, albeit from a low base. Ultimately, the medium term outlook for UK inflation is going to be determined by the interplay between the negative and transient forces of food and energy prices on the one hand, against the improving backdrop for UK consumption that will be set by employment and wages. And for those that don’t think sterling is a volatile non-core driver of inflation, the outlook doesn’t look too rosy there anyway.
Whilst economic forecasters are currently concerned about falling oil prices and the implications for global growth, weather forecasters worry about the impact an El Niño weather event could have on global weather patterns. In August, America’s National Oceanic and Atmospheric Administration (NOAA) said there is a 90% chance that the current Niño event will continue through the remainder of the year, and an 85% chance that it will last until April 2016. This could result in temperatures 2°C higher than average, or more. Bill Patzert, a climatologist with NASA’s Jet Propulsion Laboratory in La Cañada Flintridge, has described the current Niño event as “Godzilla El Niño”.
Could such an extreme weather event have macroeconomic consequences? The short answer is yes. Economists Paul Cashin and Mehdi Raissi from the International Monetary Fund together with Kamiar Mohaddes from Cambridge University investigated the effects of El Niño events on growth, inflation, energy and food prices in a recent IMF working paper.
Using an econometric model and a sample of twenty-one countries, Cashin, Raissi and Mohaddes find that the economic consequences of El Niño weather events are large, statistically significant and common across different regions. The results of the analysis are below.
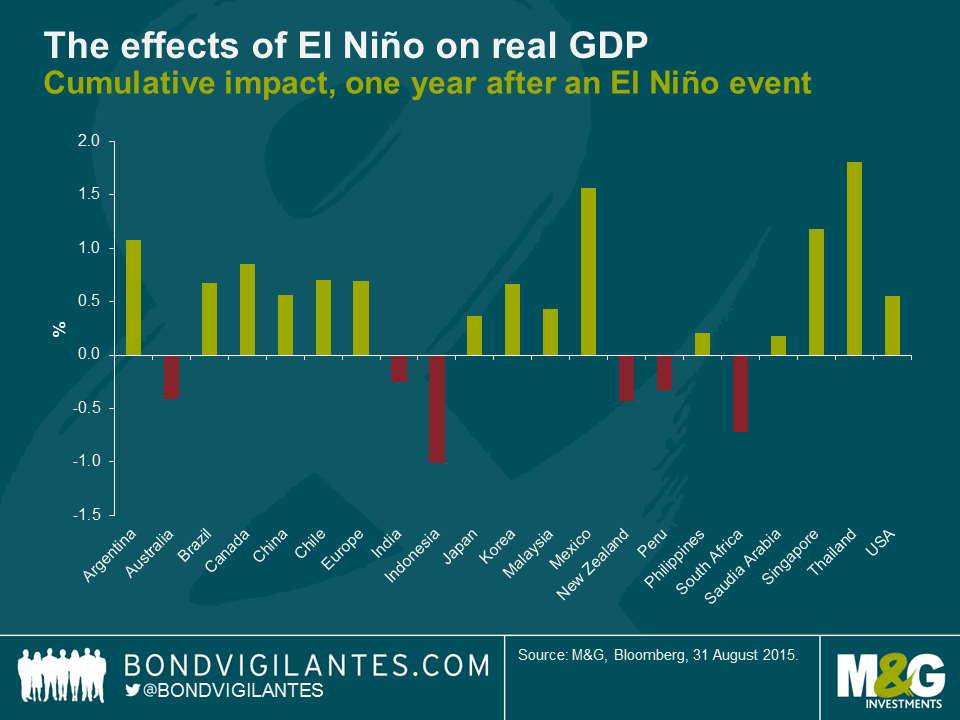
Countries impacted detrimentally by El Niño from a growth perspective are Indonesia, Australia, and New Zealand. El Niño causes hot and dry summers in Australia resulting in a higher number of bush fires and reduces wheat exports, resulting in higher wheat prices. In New Zealand, lower agricultural output is expected as the country attempts to deal with both floods and drought. Drought in Indonesia is harmful to the local economy and would likely result in higher global prices for commodities like coffee, cocoa, and palm oil. The authors also note that the extraction of nickel (Indonesia is the world’s top exporter) will become more difficult as mining equipment relies heavily on hydropower. South Africa will also be hit by drought, resulting in lower agricultural production.
Some countries growth profiles may actually benefit from an El Niño event. For example, droughts in the northern parts of Brazil could drive up global prices for coffee, sugar and citrus. However, the negative impact of this is mitigated by increased rain in eastern Brazil, leading to higher agricultural production. More importantly, trade spillovers with other Latin American and developed nations suggest a positive overall effect on Brazilian economic growth.
In Mexico, El Niño is associated with fewer hurricanes on the east coast bringing stability to oil production. For the United States, wet weather is expected in California (which may end four years of drought). This will benefit crops of limes, almonds and avocados. There could be warmer winters in the Northeast, increased rainfall in the South, and a decrease in the number of hurricanes that hit the East coast. Singapore benefits from an increase in trade as demand increases in the developed world.
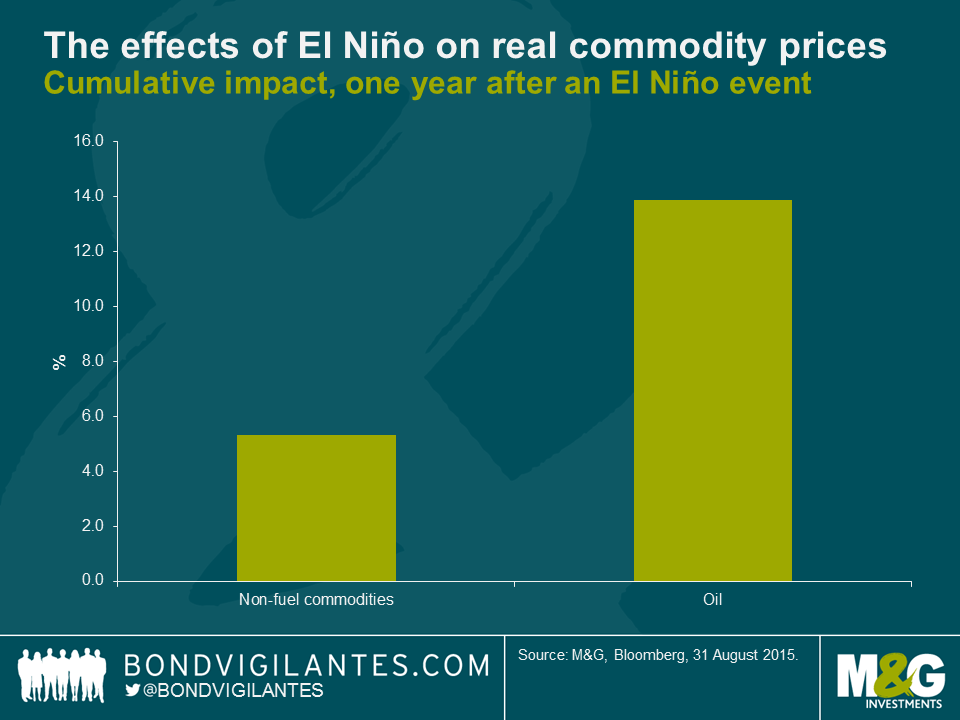
Turning to the effects of on commodity prices, Cashin, Raissi and Mohaddes note that the higher temperatures and droughts following an El Niño event, particularly in Asia-Pacific countries, not only increases the prices of non-fuel commodities, but also leads to higher demand for coal and crude oil as lower electricity output is generated from both thermal power plants and hydroelectric dams. In addition, farmers increase their water demand for irrigation purposes, which further increases the fuel demand for power generation and drives up energy prices. The authors confirm that crude oil prices (as a proxy for fuel prices) sustain a statistically significant and positive change following an El Niño shock.
Higher non-fuel commodity and oil prices will likely result in higher global inflation levels. Those countries that are most affected by rising inflation levels that are the result of El Niño are Mexico (+104bps), Brazil (97bps) and Indonesia (91bps). These large effects are a result of the high weighting of food in the CPI basket of these countries. Inflation in the US and Europe increases by only a small amount (14 and 9 bps respectively) according to the econometric model.
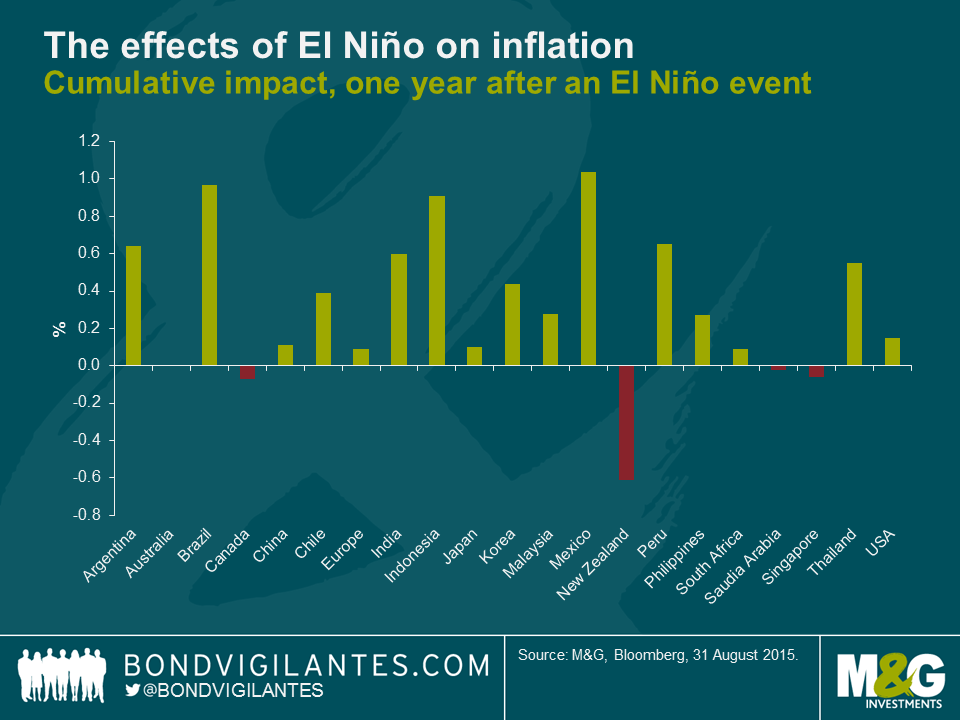
Extreme weather conditions have the ability to restrict the supply of agricultural commodities, create food price inflation which leads to higher overall inflation, and generate social unrest in those countries where food represents a substantial portion of the consumer basket of goods and services. While Australia, Chile, Indonesia, India, Japan, New Zealand and South Africa face a short-lived fall in economic activity following an El Niño weather shock, the United States, Europe and China actually benefit (possibly indirectly through third market effects) from such a climatological change.
If the “Godzilla El Niño” takes hold as the NOAA expects, the global economy will likely be hit by short-run inflationary pressures, as global energy and non-fuel commodity prices rise. But it will be important to understand the effects will differ across regions, with some economies actually benefiting with an increase in demand and higher economic growth.
The Bank of England’s Monetary Policy Committee (MPC) are due to meet on Thursday and most economists expect a dovish set of minutes to accompany the announcement of no change in the BoE base rate. Additionally, the minutes will likely emphasise the risks of a persistent undershoot in UK inflation given the continued fall in commodity prices and waning global demand. Despite these risks, the MPC are also likely to indicate that the first interest rate hike remains on the horizon. The decision to eventually hike interest rates will not be taken lightly, and the MPC will be having a long think about the potential labour market impact when a rate hike eventually occurs.
Monetary policy works with a lag; the BoE estimates this to be approximately two years in the UK. The relationship between rate hiking cycles and unemployment figures has therefore historically taken time to fully feed through the economy.
Since 1971, the BoE have undertaken six separate rate hiking cycles in the UK. After the initial rate increase in each of these, unemployment has continued to fall on average for the next 22 months, which is just shy of the BoE estimation of a 24 month lag. Given that the UK unemployment rate has been on a downward trajectory since mid-2012, history suggests that even if the MPC hikes rates, it will likely fall significantly further from the current level of 5.2%.
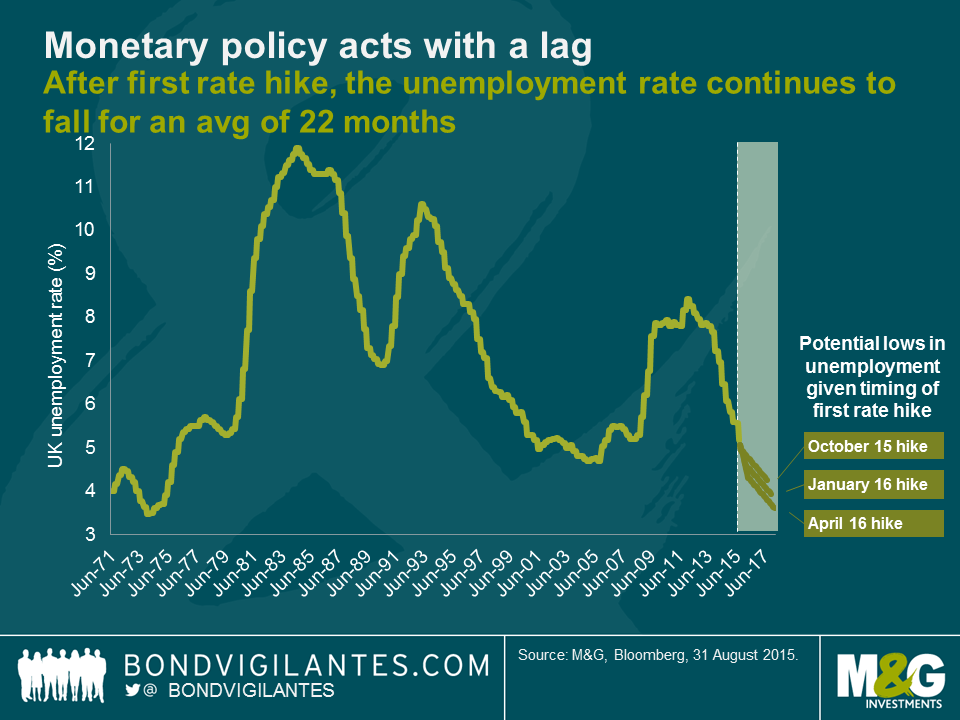
Indeed, if the BoE rate hiking cycle were to commence in October of this year, the graph above forecasts that the corresponding unemployment rate could potentially bottom out at 4.25% in August 2017. Building on this idea, if we extrapolate the current downward trajectory in unemployment and assume a later rate hiking cycle starting in April 2016, this predicts an unemployment rate trough as low as 3.61% by February 2018. Unless the BoE acts soon, the anticipated fall in UK unemployment from current levels could potentially return us to the multi-decade low unemployment rates last seen in the inflationary early 1970’s.
The trauma the BoE experienced during the recession was typified by Sir Mervyn King’s comments which I wrote about in 2012, when he said that we were not yet half way through the crisis. Sir Mervyn suggested that rates would stay at 0.5% until the end of 2015. Well, we are now approaching the end of that time frame window and the BoE has only fear itself as to when to take the economic action to slow a potential inflation problem. The current members of the MPC should take inspiration from the appropriately titled Lily Allen song “The Fear” which was the UK no.1 single the last time the committee moved rates in March 2009:
“And when do you think it will all become clear?
‘Cause I’m being taken over by the fear”


Sign up to the Bond Vigilantes mailing list to ensure you never miss a great article from our expert Bloggers. We will email all new articles to your inbox, meaning you can stay on top of the world of Bonds.
I confirm that I would like to receive information about Bond Vigilantes and products and services from M&G Securities Limited.
We will use the email address and personal data you have shared with us to send you this information. For existing customers, submitting your contact details and requesting to receive this information from us, will replace any earlier choices you have made in respect of marketing information.
You can unsubscribe from marketing at any time, at which point we will not send any further marketing information to you, by selecting the unsubscribe link in all communications.


