
Rolldown
A dispatch from the number crunchers – Yield curve rolldown
By Matthew Russell
15 April 2026

Following the closure of the Third Avenue fund earlier this month, liquidity issues are once again at the forefront of investor’s minds when it comes to the high yield market. Ultimately, conditions will only improve with structural changes to the market but in the meantime we think there are several steps that can be taken to help improve the underlying liquidity profile of a high yield portfolio.
Buy and Hold – by keeping portfolio churn low and buying securities with a view to a long term holding period and accepting that there will be some price volatility, the liquidity needs of a portfolio are automatically curtailed. This also means corporate fundamentals and the underlying credit worthiness of an issuer over the long term are bought more sharply into focus at the point any purchase is made. The question “Would I be happy to hold this bond through periods of market distress” is a good one to ask. If the answer is “yes”, then the chances of finding a buyer during such periods are greatly enhanced.
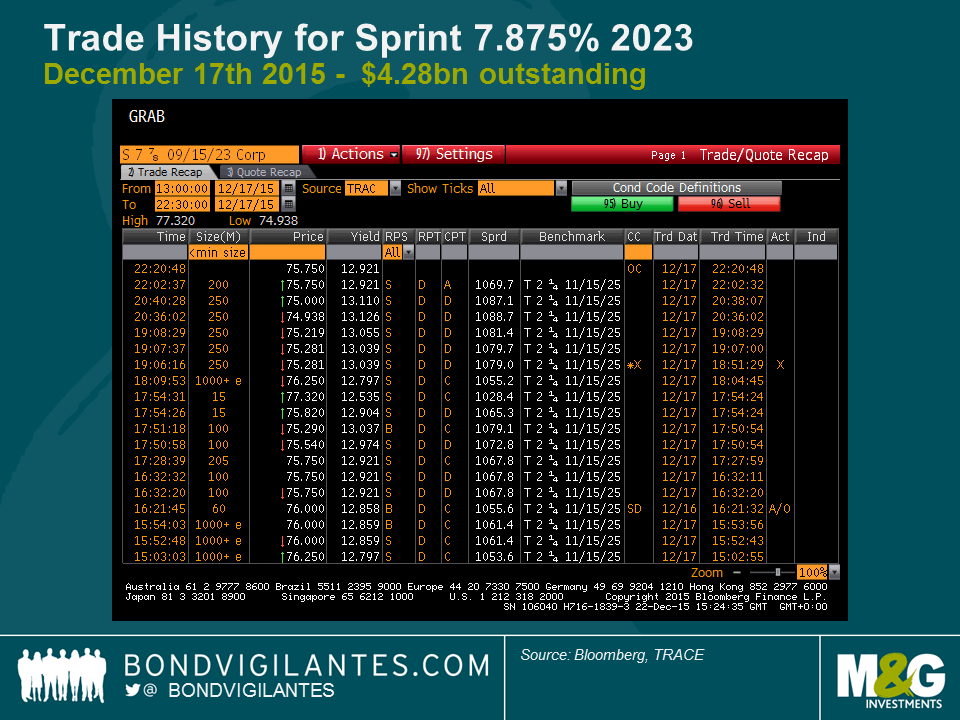
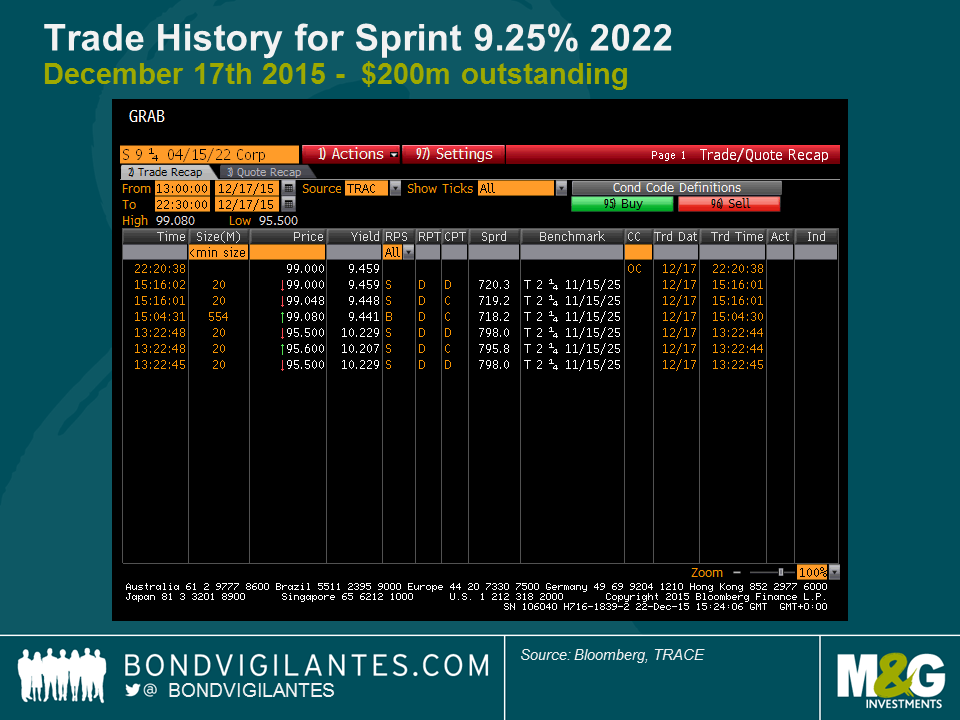
Stick to larger bond issues – The bigger the bond issue, the greater the investor base and the greater chance of being able to match a buyer and a seller (we illustrate this below by comparing the recorded activity trade activity for a $4.28bn bond, and a $200m bond issued by the same company). However, this can be a double-edged sword. The larger a bond issue, the more likely it is to be a constituent of an ETF portfolio which can be disadvantageous during periods of large redemptions.
December 17th 2015 Trade History for Sprint 7.875% 2023, $4.28bn outstanding:
December 17th 2015 Trade History for Sprint 9.25% 2022, $200m outstanding:
Diversify by market – Trading environments can and often do differ in different markets. A portfolio that can invest across the range of ABS, financials, corporate, sovereigns, emerging markets, fixed rate or floating rate, Europe or the US can often exploit better liquidity conditions in one market when another is facing difficulty.
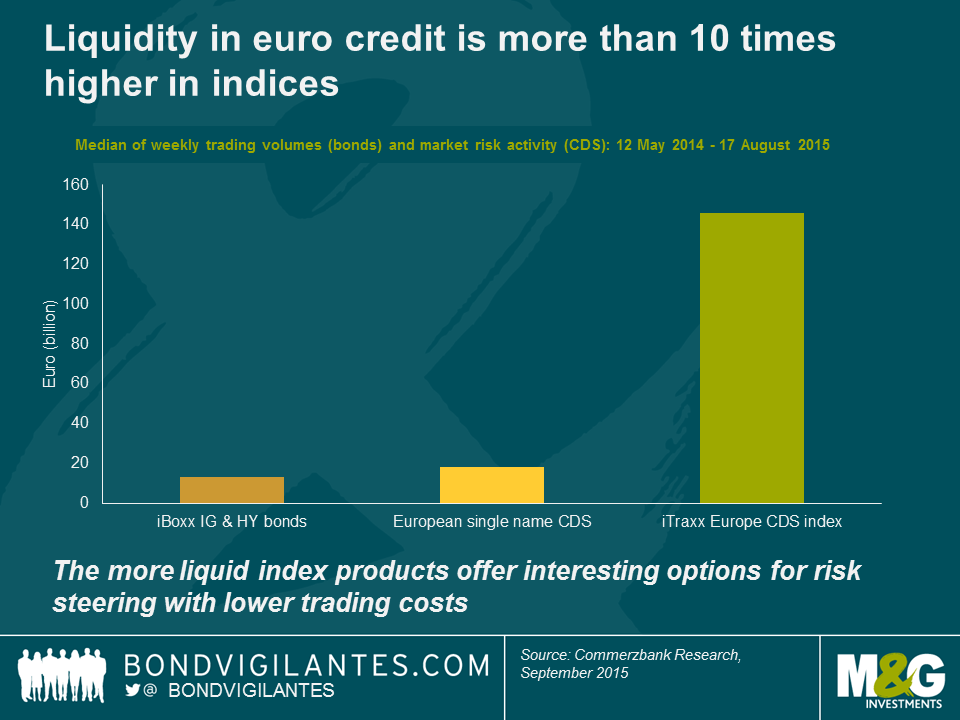
Use liquid proxies – The daily volume that trades in the synthetic CDS index market is an order of magnitude greater than the physical cash market. Keeping part of a portfolio in such instruments provides access to a deeper pool of liquidity and can provide a useful buffer in periods when the physical market conditions worsen. However, there is an opportunity cost in terms of stock selection that needs to be considered.
Keep cash balances higher – The most effective way to boost liquidity in a portfolio is the simplest: hold more cash. 5% is the new 2%. Again, there are opportunity costs in terms of market exposure and stock selection, but the benefits in terms of liquidity are immediate and tangible.
It’s important to stress that none of these measures are a silver bullet, but they are mitigants. They can buy time and help investors tap liquidity. In today’s high yield markets, the question of how a portfolio’s liquidity is managed has become just as important (if not more so) than its investment position.
One of the major factors that has enabled inflation to stay low despite the economic strength in major western economies has been the fall in the price of oil. Given the huge price volatility over the past 18 months it is interesting to depict the falling influence of oil on actual end inflation.
In the UK, the most direct way that changes in the oil price affect inflation is through petrol prices. Falls in the input cost translate into a fall in the price at the pump. The price at the pump is however not just a function of the price of oil, but includes costs of transportation, retail margin, and most significantly tax and duty. According to petrolprices.com, the cost of a litre of petrol can be broken down as follows:
Duty: 57.95p
Product: variable
Retailer/delivery: 5p
VAT: 20%
If we use the above as a guide we can examine how changes in the price of oil (product) can affect headline inflation. The chart below shows how changes in the oil price feed through to the price of petrol at the pump.
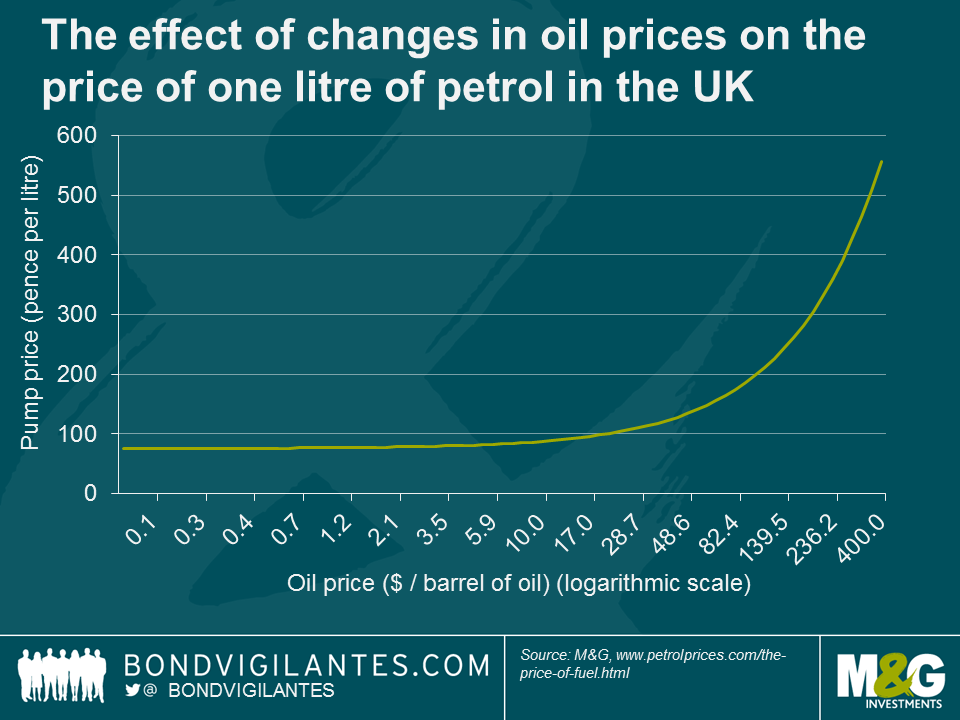
As you might expect, it is not a one for one relationship. As the price of oil falls, its effect on the price of petrol becomes less significant because it makes up a smaller and smaller portion of the total price at the pump. So a 50% fall in the price of oil from $160 to $80 creates approximately a 35% fall in the price of petrol from 267p to 172p. A further 50% fall in the price of oil from $80 to $40 creates a 28% fall in the petrol price and a 50% fall from $40 to $20 translates to only a 19% fall in the petrol price. Although the GBP/USD exchange rate is another factor in determining the pump price given that oil is priced in dollars, the above illustrates that as the oil price falls it has a weaker and weaker effect on inflation.
There is also a secondary effect of weak oil prices, because as prices fall, the percentage in the inflation basket will fall. Thus, energy price falls become less significant with regard to headline inflation.
The down draft in oil prices is coming closer and closer to an end, with its effect on inflation reducing the further it falls. Given other areas of scarcity, such as in the labour market, we would be surprised to see inflation stay this low over 2016. The downward impetus of falling oil prices on inflation will continue to become less meaningful as the bear market in oil progresses.
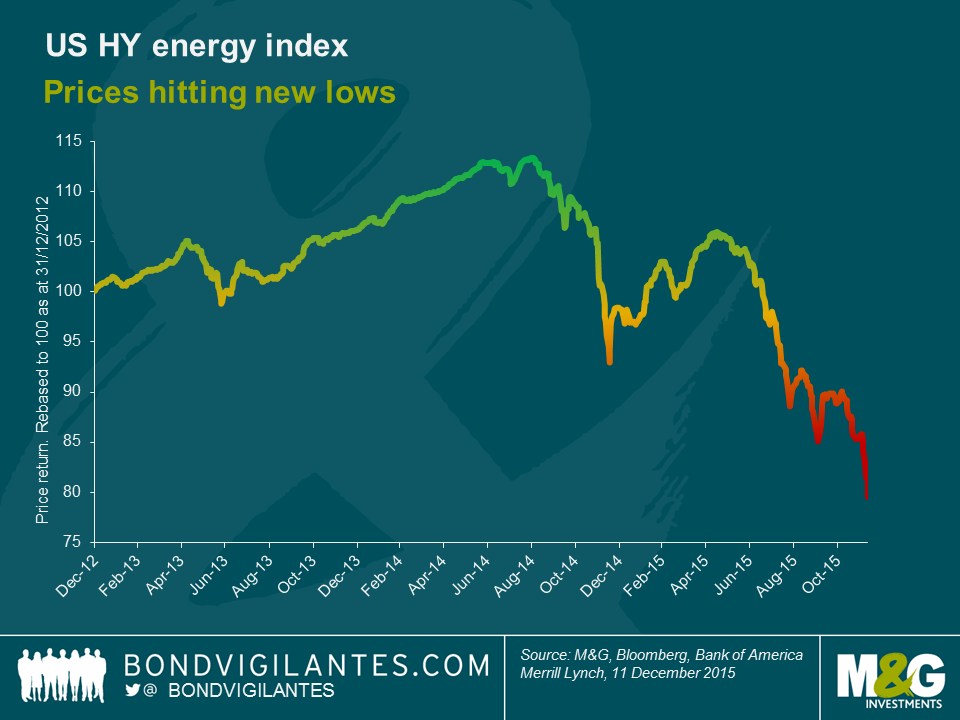
2009 through 2013 were some very good years for the US high yield market. And the energy subset was no exception. Returning 51%, 13%, 9%, 12% & 6% in each of those years, it’s not surprising that the BofA Merrill Lynch US High Yield Energy Index practically trebled in size. Voracious issuance, much of it to fund shale oil development, was met with equally intense buy-side demand and with it came the all too familiar weakening of covenants.
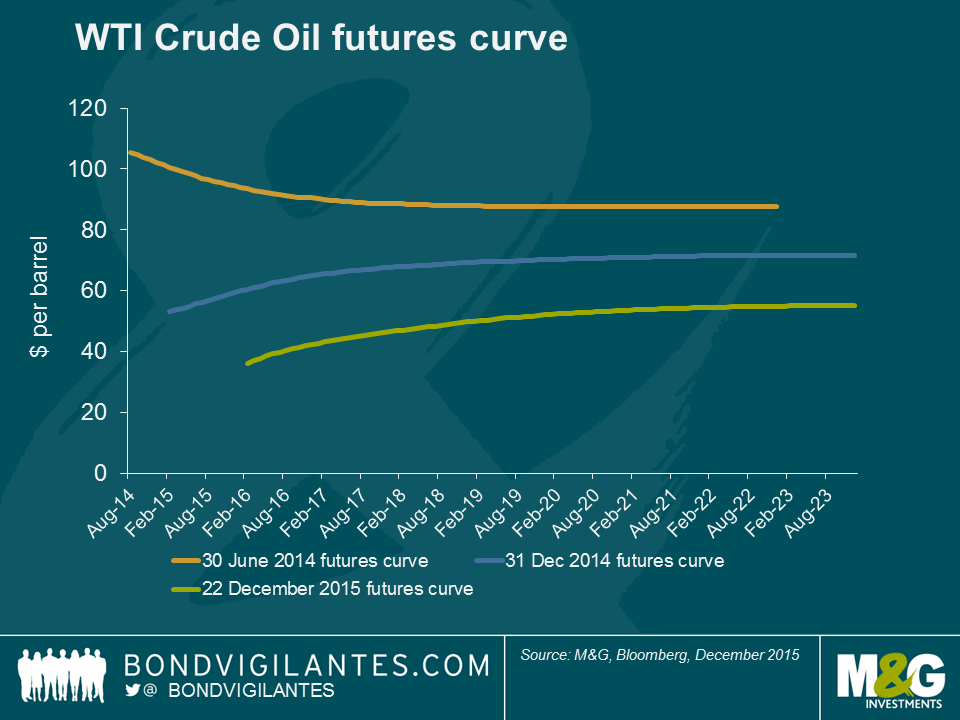
But after a number of golden years, the energy market began to fall out of bed in 2014. Expectations of weaker global demand, especially from the Far East, coupled with a supply glut and a stronger US Dollar saw a radical reappraisal of the future prospects for prices.
It’s easy to forget that back in mid-2014, only some 18 months ago, WTI was priced to sell for around $88 five years forward. By the end of that year that number had fallen to $70, and now the same figure looks set to finish 2015 around 51 bucks.
Such a rapid reappraisal of the future value of oil and gas has had drastic consequences, especially for the most levered of producers. And with little expectation of a significant recovery in prices, the focus has turned to liquidity and its management via distressed exchanges.
Distressed exchanges, defined by Moody’s as an offer to creditors of ‘new or restructured debt, or a new package of securities, cash or assets, that amounts to a diminished financial obligation,’ became a notable feature of 2015. We count at least eleven significant exchanges during 2015.
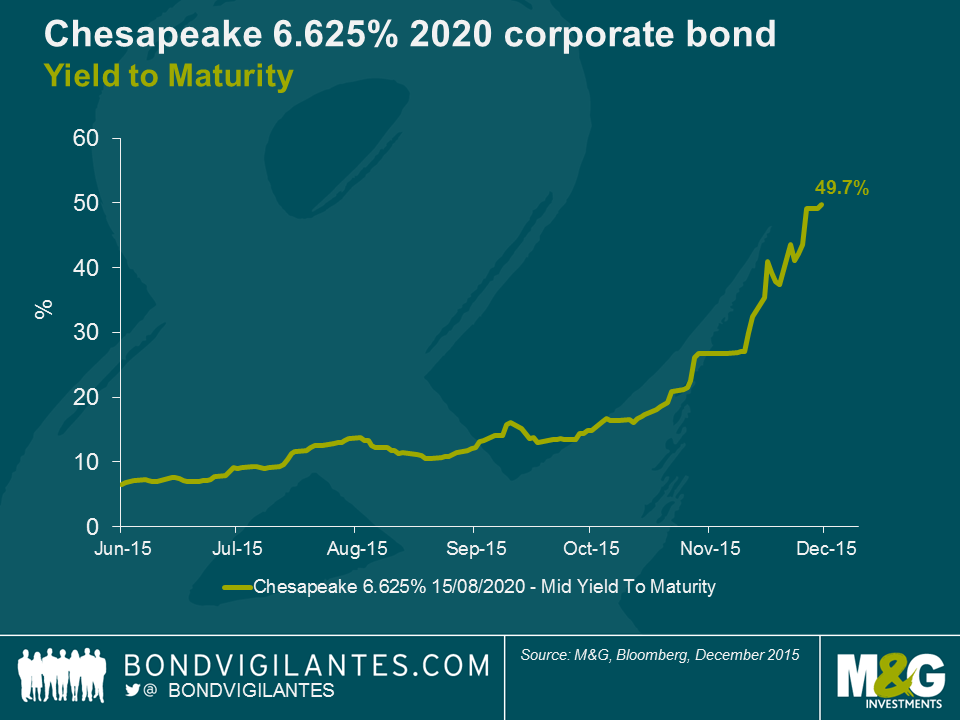
The latest and perhaps most significant has come from Chesapeake Energy. Collapsing natural gas prices and little prospect of attracting equity capital has left the company with a looming liquidity crunch. In response, Chesapeake offered earlier this month to exchange up to $3bn of their unsecured liabilities for second lien secured debt, with bondholders accepting a write-down on their existing claims. So in a nutshell, the company reduces its debt load in return for offering some security over its asset base.
Which immediately begs a number of questions. What’s in it for the company? What does it mean for its stakeholders, especially investors in the company’s bonds? And finally, is this exchange enough to ‘right size’ the company’s balance sheet?
Having seen the yield on its five year debt rocket towards 50% during the second half of the year (see chart below), Chesapeake has little prospect of refinancing over $1.5bn of bonds that come due in the next eighteen months. The company does, however, have significant room to incur secured debt. By offering to exchange near-term maturities into longer dated debt, as well as asking bondholders to accept a write down on their claims, the company is able to reduce its liabilities and buy precious time whilst praying for a recovery in gas prices.
The outcome for stakeholders, especially bondholders, is less straight forward. Without going into the detailed mechanics of the exchange, it is difficult to opine on the best course of action without the benefit of hindsight. At its core, and this is true of most of these exchanges, bondholders must weigh the future prospects for the business versus the variety of options put to them by the company and the costs involved. Given the outcomes are many and uncertain; the decision process is far from straightforward.
Ultimately, whether the exchange offered by Chesapeake –and the dozen or so others we have seen this year– serve to sufficiently right size the balance sheet, only time will tell. What we can be sure of is that distressed exchanges and financial engineering is a likely feature of 2016.
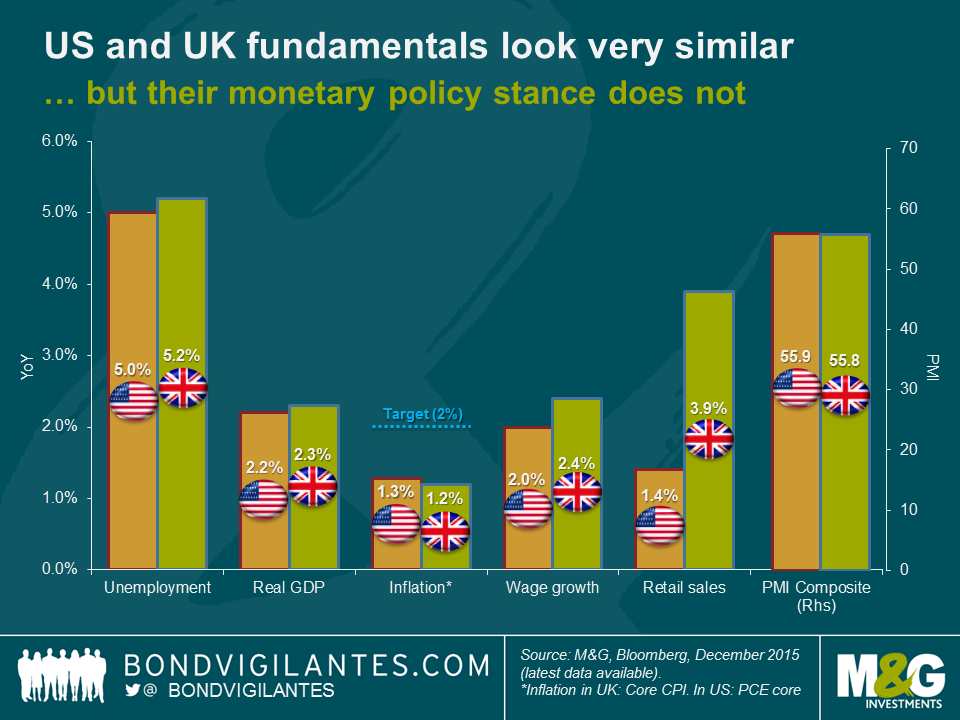
With the Fed recently raising its interest rates via a unanimous vote, I’ve been wondering whether the UK will shortly follow suit. The market seems to think not, pricing in the first UK rate rise in Q1 of 2017, compared to two further US rate hikes in 2016. At face value this huge divergence feels strange; both countries are targeting (and undershooting) a 2% inflation rate, both have similar rates of year on year GDP growth and both have seen significant labour market improvements since the onset of the financial crisis (the UK arguably more so as inroads have continued despite the backdrop of an increasing participation rate, in comparison to the US decline in this measure). Indeed, the large reductions in unemployment rates indicate that the economies are at or approaching full employment, which should in turn bring mounting wage pressures and generate domestic inflation. All solid justification for considering a rate hike, which is why the US has done just that.
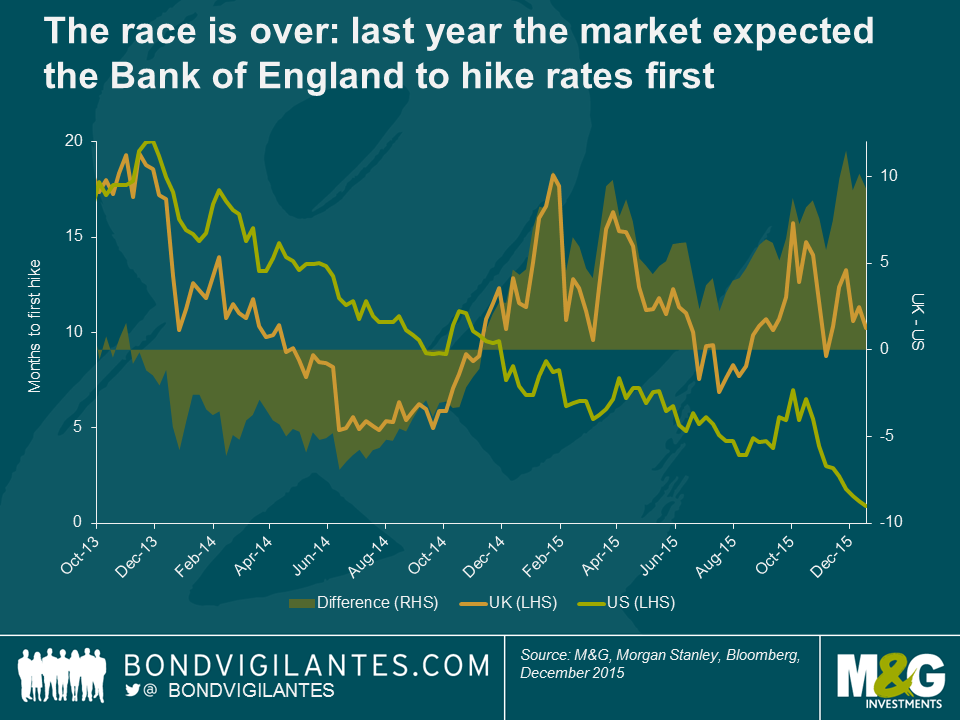
Looking at the graph below, it is clear that up until the end of last year, the market was predicting that the UK would be the first to raise rates. Even this year there were periods where it looked to be neck-and-neck. With the US recently winning the rate-hiking race, why has the runner-up now fallen so far behind?
Though the macroeconomic fundamentals may look very similar, the micro factors paint a different picture.
1) WAGES: Last week I saw Minouche Shafik speak in London. As the Deputy Governor of the Bank of England, appointed specifically to oversee markets and banking, her message was clear: she will not be voting for a UK interest rate hike until she has witnessed a sustained pick-up in wages (Shafik is waiting to witness wage growth that is 2-3% above productivity, which is more aligned with the pre-recession years, which she believes will ensure that inflation returns to target). Here’s the kicker; the latest data release showed that the UK headline (3 month average) wage growth rate fell from 3.0% to 2.4% in October (excluding bonuses, annual growth fell from 2.5% to 2.0%), while productivity rose at its fastest quarterly rate in 4 years, with output per hour rising 0.9% in Q2. Given these numbers, it’s highly unlikely that Shafik will be voting for a rate hike at the next MPC meeting on 14th January.
2) CURRENCY: Both the UK and US have experienced trade weighted appreciation, but this has had a larger impact in the UK where imports and exports constitute a higher proportion of GDP (approx. 30% in UK Vs. 17% in the US). The appreciation of the currency makes imports cheaper and exports more expensive which manifests as downwards pressure on growth and inflation. Given this relationship, it is important to consider the UK’s trading partners. The US is a relatively closed economy in comparison to the UK, whose main trading partner is Europe, where monetary easing remains on the table for the foreseeable future (some market participants are not forecasting an ECB rate hike until Q4 2018). The Bank of England must therefore be mindful of a divergence in policy which could cause the currency to significantly appreciate, otherwise UK imports invoiced in euros would essentially import deflation. Sterling is already up 6.7% year to date. Further appreciation brought on by a rate hike would harm exporters and hamper growth strategies which pursue diversification away from domestic demand.
3) POLICY: It is well known that monetary policy works with a lag, but this tends to last longer in the US due to the greater prevalence of fixed rate mortgages; the UK is therefore granted some leeway with regards to the timing of its monetary policy implementation. Fiscal policy is another consideration, as the Conservative UK government are committed to fiscal austerity while the US are entering a pre-election period and are more likely to see their fiscal deficit increase. The UK policy is likely to be contractionary – which would make the case for further easing rather than hiking- potentially delaying lift-off further. Thirdly, minimum wages in the UK are high compared to its European counterparts and set to increase. If this attracts a greater supply of low-skilled workers via increased migration, wage growth could credibly plateau, ultimately limiting upwards pressure on pay and dashing any hopes of UK inflation hitting its target. Finally, the real possibility of the UK leaving the EU certainly deserves a mention since the referendum – regardless of the outcome – is sure to generate some currency volatility in the build-up and aftermath of the vote (the date has not yet been set, but it has been suggested that this may take place in June or September next year). If the UK does vote to leave the union, this will have wider-ranging repercussions for the economy. This certainly gives the Bank of England reason to pause now, before the referendum result becomes clear.
Despite these three reasons to delay monetary policy lift-off, the UK recovery nevertheless remains robust. Consumption is solid, investment is recovering and productivity is returning. The main piece of the missing puzzle is – as Shafik says – wages. Although UK rate increases may not be immediately trailing the Fed, I wouldn’t be surprised if this occurs much sooner than the market expects.
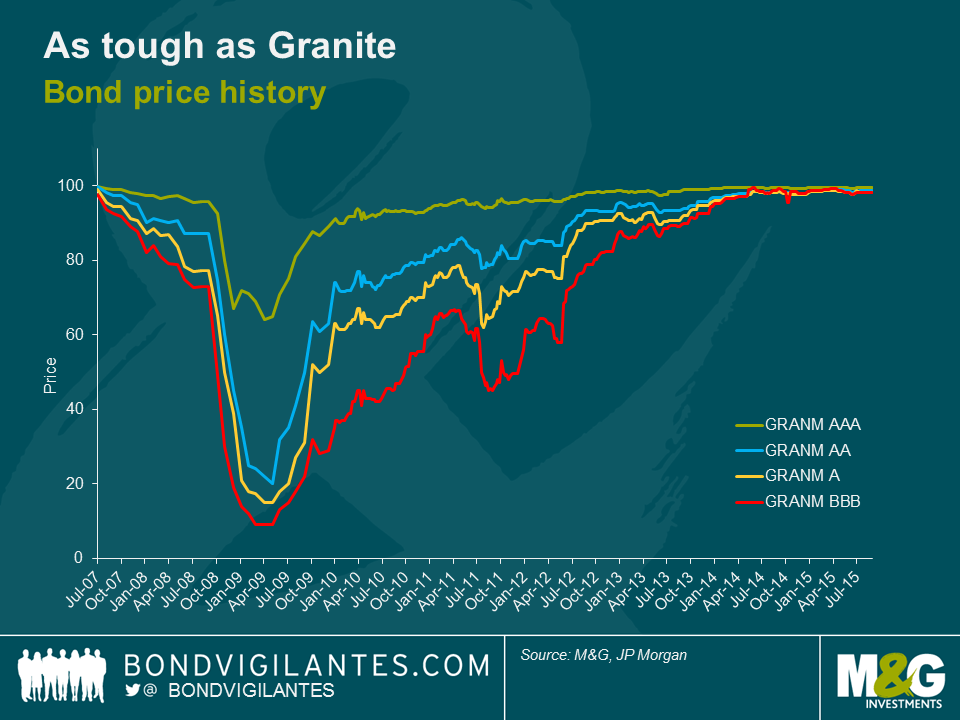
This weekend the team were doing more than just our Christmas shopping, we were also saying a fond farewell to one of our favourite investments of recent times – our Granite Residential Mortgage Backed Securities (RMBS).
Granite was the name that Northern Rock gave to the vehicle it used to securitise the mortgages that it originated before blowing up in 2007 – when it was no longer able to fund itself in the wholesale money markets – and eventually being nationalised in 2008.
Unsurprisingly the Granite bonds were hit hard in the panic of the financial crisis. Not only were they tarnished by owning assets that were originated by a bank suffering the UK’s first bank run in 150 years, but also because the securities were structured in a similar way to the low quality, sub-prime mortgage backed assets in the US that ignited the whole crisis when they began to implode.
Granite class A’s, the bonds at the top of the stack and therefore the most credit worthy (originally rated AAA by the agencies) fell to a cash price in the mid 60’s in early 2009 and the class C’s (originally BBB) hit single digits at their lows.
After nationalisation, the responsibility for the management of the remaining assets including the Granite structures fell to UKAR (UK Asset Resolution Limited), effectively the UK Government’s bad bank. UKAR was established with the goal of maximising value for taxpayers whilst managing the pools of mortgages issued by banks that the government had nationalised (Northern Rock and Bradford & Bingley).
In November this year, UKAR announced that it had successfully sold £13bn of assets – the bulk of which were the Granite deals – to a consortium of investors. A few weeks later the trustee announced that most of the outstanding Granite bonds would be called at par this weekend with a small remainder in January 2016. Some of the underlying mortgages have been sold to banks that are looking to increase their share of the UK mortgage market and the remainder we expect to be refinanced early next year through a combination of further whole loan sales and securitisation.
We spent a lot of time in the dark days of the crisis analysing the quality of the underlying mortgages, working out if the structure of the bonds would protect us, and ultimately whether we would get our money back. Our analysis indicated that the Granite securities were robust and housing market fundamentals would have to significantly weaken before our investment would be close to being at risk. We thought there was a lot of value in the bonds, and over time Granite grew to one of our largest holdings across a number of funds.
Importantly, I think that Granite highlights that Asset Backed Securities (ABS) can be a great investment if you take the time to understand the structural complexities and the underlying collateral. The broader asset class received a lot of bad press during and after the financial crisis, marred with the same stigma as the far worse performing US sub-prime and CDO sectors. In contrast, the performance of more vanilla RMBS deals has fared much better with very few credit losses experienced to date.
So thank you Granite, it’s been a great ride.
We did a research trip to Tokyo last month. The main discovery by my colleagues Anjulie Rusius and Anthony Doyle was that I am “annoyingly good at karaoke”. I have to put my hands up to that one. Sadly for you my singing didn’t make it into the official trip report video. Instead we discuss why, counter to popular myth, Japanese policymakers might not want either a) a much weaker yen or b) any further rise in inflation; we give a progress report on Abenomics and the “three arrows”; and we visit Asimo, Honda’s performing robot, to find out whether technology might come to the rescue of Japan’s rapidly deteriorating demographics. Today we find out that Bank of Japan Governor Kuroda has extended the maturity of JGBs he will buy as part of QQE, and increased the range of ETFs that will be purchased. He also said he knew that most people wouldn’t understand why they are doing this. We’re in that “surprised” camp – this isn’t the “arrow” that still has the power to boost Japan’s economy.
P.S. Japan is CHEAP. The yen is 25%+ undervalued. A dry martini in a posh hotel cocktail bar overlooking the Imperial Palace (who’s modest grounds were valued at more than the whole of California’s real estate market back in the day, yadda yadda) was £4. Visit Japan asap.
The temptation to ‘juice-up’ shareholder returns with low yielding corporate debt has been too much to bear for many companies and their investors in recent years. This fad has been well documented and though it may not be a trend we creditors like to observe, we haven’t been entirely surprised to see it play out in 2015 given the seemingly large valuation disconnect between the cost of debt and equity; even if the comparison is often far too simplistic.
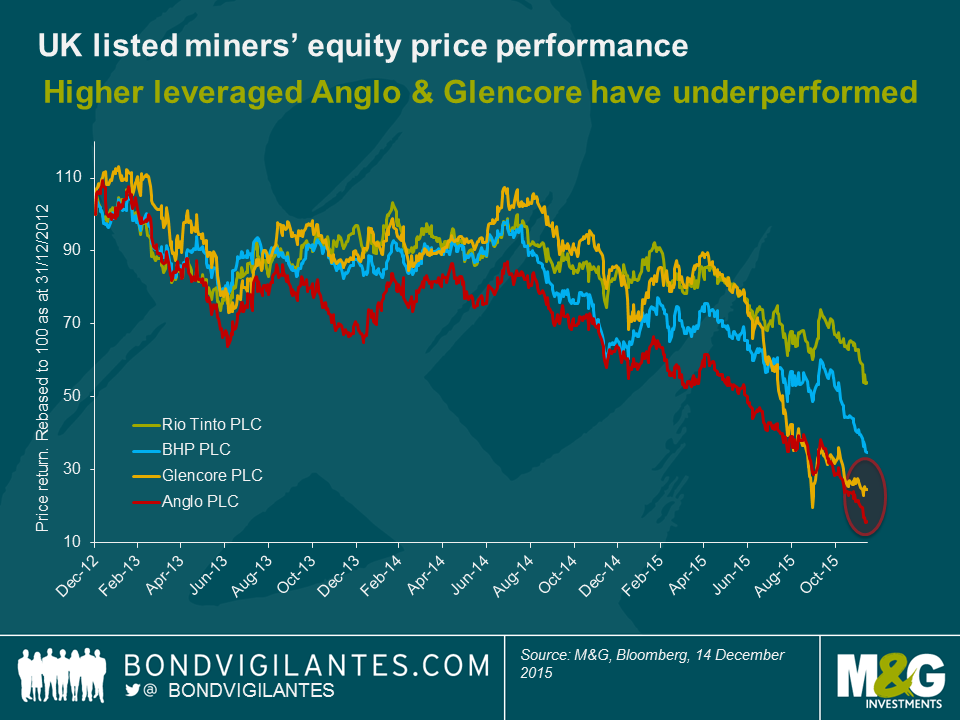
But having taken on more debt, and despite often doing so at record low yields, this has not translated into a winning strategy in 2015. Take the example of the four UK listed mining majors – Anglo American, BHP, Glencore & Rio Tinto. Back in March/April of this year Anglo was able to borrow five year € money at 1.5% and Glencore at 1.25%. Although earnings and hence equity prices had already come under pressure by Q1 2015, bond markets appeared somewhat sanguine.
But it has been tough going since then. Whilst all four miners have continued to see share price falls through 2015, the underperformance has been stark for the more levered & lower rated Anglo American (Baa3/BBB-) and Glencore (Baa2/BBB).
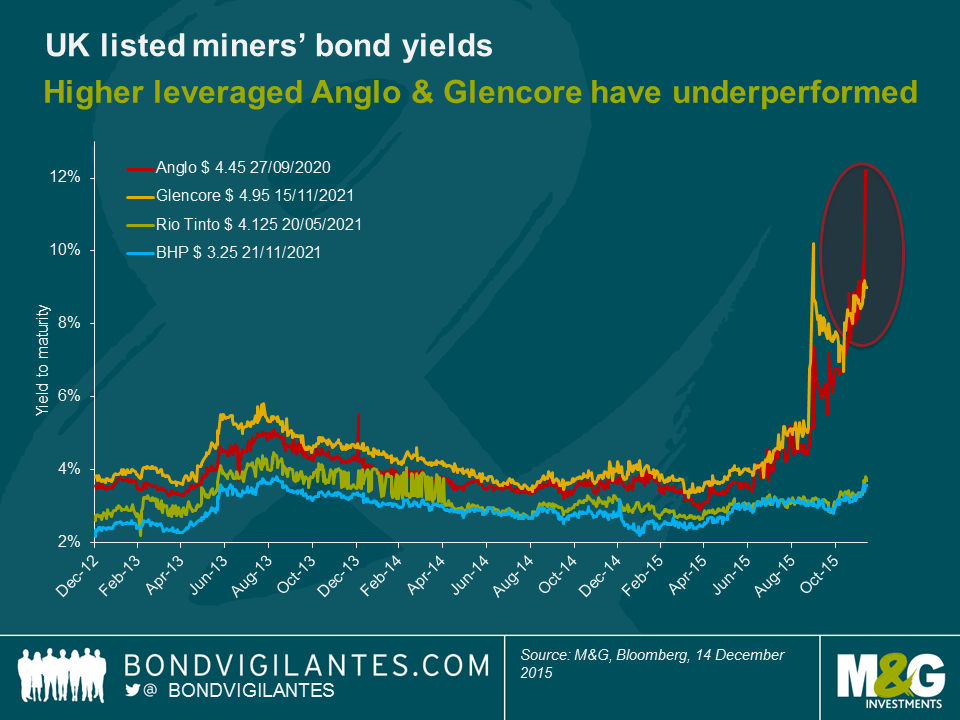
And the same relationship can be observed in bond markets. Spooked in part by the more aggressive financial policies followed by Anglo & Glencore (at June ‘15 their ratio of net debt to EBITDA was 2.2x & 2.7x) their five year $ funding jumped from 4% to approximately 9% and 12% respectively. Higher rated Rio (A3/A-) and BHP (A1/A+), both with much lower ratios of net debt/EBITDA, saw a far smaller move higher in yields from 3.2% to 3.7% and 2.8% to 3.7%.
In fact, things had got so bad by the second half of 2015 that both Glencore and Anglo were forced into something of a ‘U-turn’, announcing plans to focus on debt reduction, an equity raise, asset sales, and dividend suspension for Glencore, and major operational restructuring and dividend suspension for Anglo (Anglo has so far avoided issuing more equity but the pressure remains). Suddenly, the interests of bond holders and shareholders seemed very much aligned, with investors questioning the wisdom of running so much financial leverage, scrutinising the quality of assets and cash flow generation – bondholders especially demanding answers.
But nowhere has the risks of leverage and cyclicality been more evident than the recent experiences of the US high yield market. Having funded much of the recent shale oil & gas revolution, US high yield investors are nursing serious wounds. With oil prices almost half of where they were earlier in the year, both bondholders & shareholders are sitting on large losses as we head into 2016, with the prospect of further restructurings to come.
It seems clear that debt and equity investors alike should continue to question just how well a cyclical industry lends itself to heavy indebtedness. By their nature, cyclical industries will always be exactly that – cyclical. Debt may very well be a mainstay of a company’s balance sheet today, allowing for growth and investment, but it is rarely a panacea for an underperforming share price. We should be wary of any company that treats it as such.
As the year draws to a close, 2015 has actually been a solid if unspectacular one for the European High Yield market. Total returns of a little under 3%* compare well to negative returns in the US and Global High Yield markets. European default rates also continue to trend lower, hitting 0.14% for the last twelve months to the end of November according to data from Bank of America Merrill Lynch. All good then?
Well, not really. The overall numbers look ok but this masks some dramatic pockets of weakness within the market. Several bonds have seen some large losses. The most notable perhaps being an 86% price drop by bonds issued by Abengoa SA, the Spanish renewables company. This has not been an isolated incident either. Investing in this environment brings to mind an iconic scene in “The Matrix”, when Neo, the main character, survives a sustained hail of bullets by effectively dodging them. He takes a few marginal hits but the point is he survives by ducking the more dangerous, fatal projectiles. Likewise, a successful 2015 for most European high yield investors has been defined in similar terms: you’ve had a good year if you dodged most of the bullets.
So where has the damage been done? In the table below, we show the worst performing bond issuers this year in percentage terms. For the sake of simplicity, where there are multiple bonds issued by the same company, we have simply included only the worst performing amongst them.
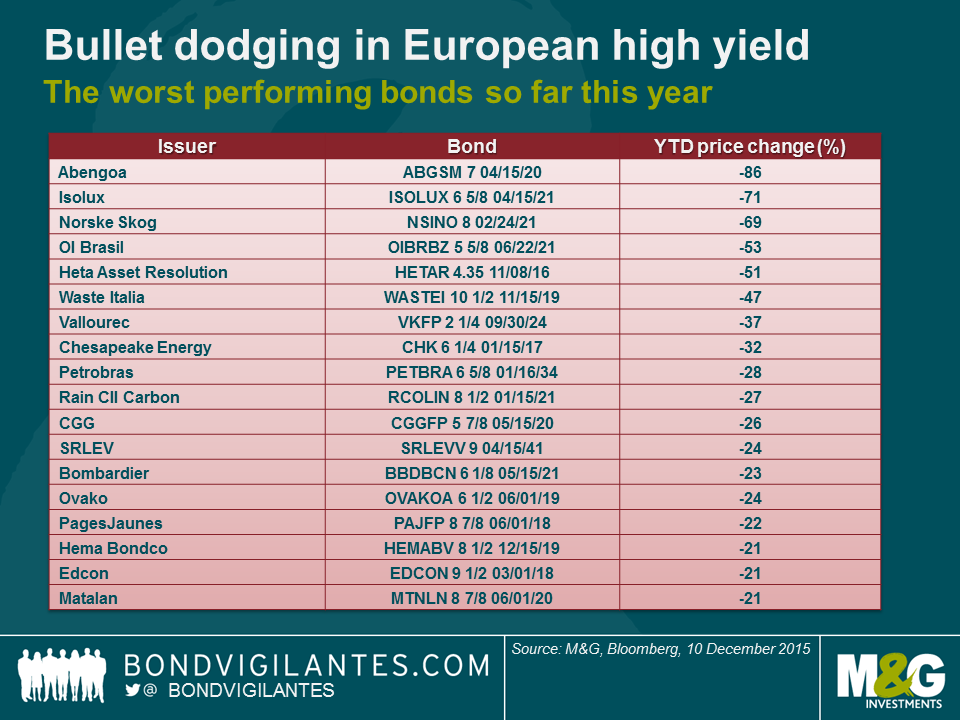
From the above, we can draw out a few themes. The big losses have been experienced in the following situations:
Indeed, I think it’s fair to say much of the recent weakness in the US high market has been driven by many of the same factors (not least the moves in the energy and commodity related space). The difference is that exposures to some of the poorer performing sectors are comparatively much higher in the US, so the overall impact is more meaningful.
What I think is interesting here is that this shows the European market has not been immune to such forces and investors still need to be cognisant of the risks, particularly as the market has held up so well this year. Bullet dodging, therefore, is still likely to be a useful skill going into 2016.

*Total return of +2.8% year to December 9th, BofA Merrill Lynch European Currency HY Index
In our recent Chicago video we touched upon the subject of recent mergers and acquisitions (M&A) activity in North America having surpassed pre-crisis volumes. Though hard to quantify, it’s safe to assume that the M&A surge has been one of the main driving forces behind the widening of credit spreads in the USD investment grade (IG) corporate bond universe this year. Numerous IG companies have made use of low interest rates and engaged in debt-funded takeovers, bringing leverage up and risking credit rating downgrades. New bond issues brought to market in order to finance these transactions have put additional upward pressures on credit spreads of outstanding bonds.
Healthcare firms in particular have embraced the M&A frenzy. According to Reuters, cumulative healthcare deal volumes are expected to exceed USD 600bn this year, dwarfing the previous annual record of c. USD 390bn set in 2014. Based on three case studies within the pharmaceutical sub-sector, we want to illustrate that M&A activity can produce the whole range of outcomes for IG corporate bond investors – the Good, the Bad and the Ugly.
Let’s start on a positive note. IG bond investors are likely to lock in profits if they hold bonds of a company that is acquired in a friendly manner by a (markedly) higher-rated firm. Take, for example, the case of Allergan, Plc (AGN), best known for producing Botox. The company in its current form came into existence after a long series of mergers, the last one in March 2015, when Actavis, Plc acquired Allergan, Inc. for around USD 66bn. The deal financing package comprised one of the biggest USD corporate bond offerings on record (USD 21bn across several tranches), including AGN 3.8% 2025s. The bonds were issued at a higher asset swap (ASW) spread than the US IG pharmaceutical index and subsequently underperformed against the sector average – see the chart below. However, when in late October news broke that Pfizer and AGN had entered friendly M&A talks, AGN spreads tightened aggressively. The transaction, which is valued at around USD 160bn and would create the world’s biggest drug maker, has not been completed, but there is a very good chance that BBB- rated AGN will merge with AA/A+ rated Pfizer, which would be a big credit-positive event for AGN. Consequently, AGN 3.8% 2025s have outperformed relative to the pharma index by c. 30 bps in ASW spread terms over the past month.
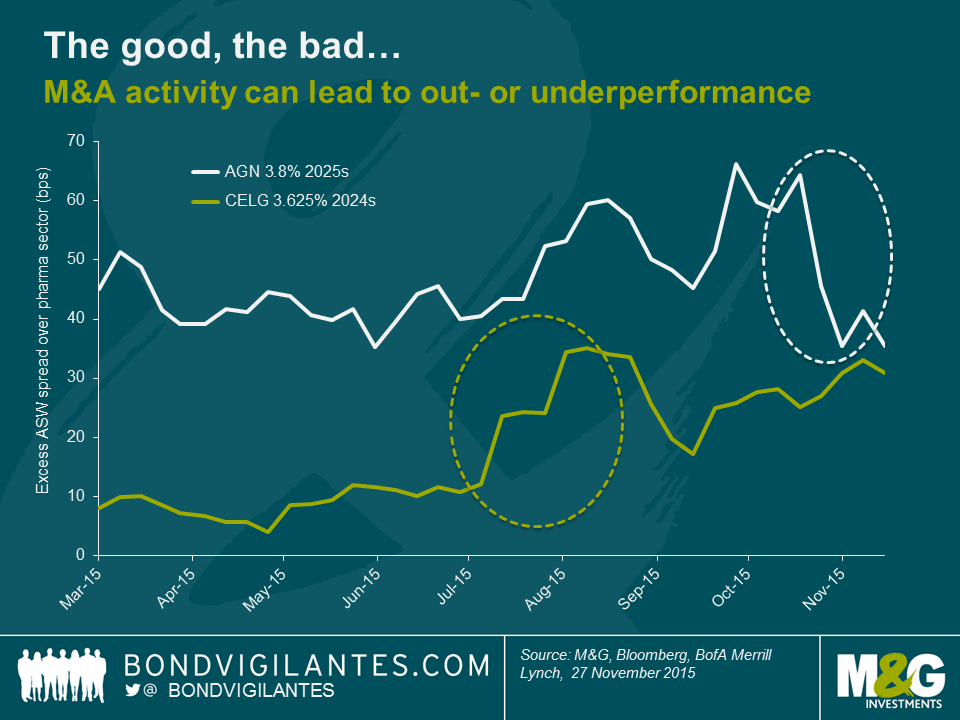
M&A quick-wins like this are the exception, though. IG companies (typically well-established, sizeable firms) are more likely to be the acquirer, not the target, which often causes pain for their bondholders, at least in the short-run. This holds true for the case of then BBB+ rated Celgene (CELG) buying Receptos for more than USD 7bn to boost its inflammation and immunology drug portfolio. Upon announcement of the deal in mid-July, outstanding USD CELG bonds, e.g., CELG 3.625% 2024s, widened relative to the US IG pharma index. Having traded at a small excess spread of around 10 bps vs. the sector average over the first half of the year, the spread premium jumped to nearly 25 bps. The issuance of new USD bonds to finance the transaction in late July, combined with a rating downgrade to BBB due to the increasing leverage, led to a second surge in excess spread of the outstanding bonds to c. 35 bps above the sector. CELG bonds then briefly outperformed the pharma index before their spread premium started to widen yet again, not least because CELG officials expressed further M&A appetite.
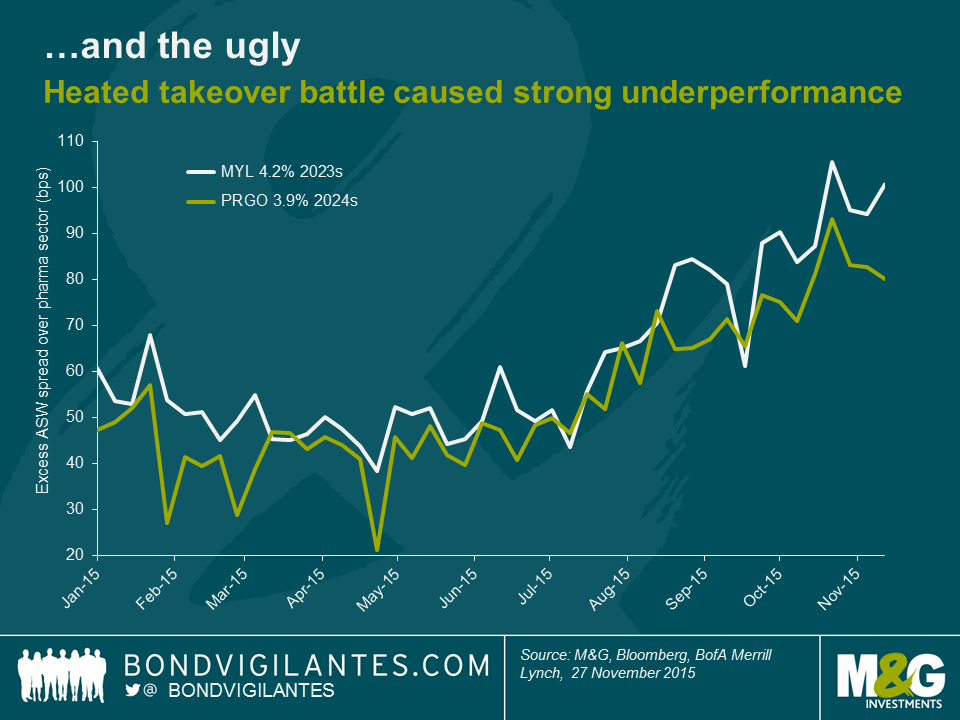
We’ve talked about the Good and the Bad – now on to the Ugly. It’s hard to find a more suitable example than the ultimately unsuccessful attempt of Mylan (MYL) to acquire Perrigo (PRGO) this year. A full account of the twists and turns in this M&A odyssey would go well beyond the scope of this blog. In a nutshell, MYL approached PRGO with an unsolicited takeover bid in spring 2015. MYL then tried to convince its own shareholders and those of PRGO of the benefits of the proposed transaction, while simultaneously fending off a hostile bid for its own business from generic drugs rival Teva. Using a poison pill defence strategy, MYL eventually succeeded in blocking Teva in July. In the meantime, the MYL-PRGO situation was turning increasingly hostile. Even after MYL raised its bid, PRGO executives fought tooth and nail against the takeover. In September Perrigo Chairman and CEO Joseph C. Papa sent an open letter to Mylan Chairman Robert J. Coury calling MYL’s offer “grossly inadequate” and “value destructive”, while highlighting in his view “some very troubling corporate governance values at Mylan”. The rating agencies expressed their concerns regarding the credit-negative effects of the transaction; S&P even questioned MYL’s IG status putting their BBB- rating on negative watch.
Unsurprisingly, credit markets did not take kindly to these developments, as shown in the chart below. USD bonds from both MYL and PRGO had been trading at a spread premium of around 50 bps over the US IG pharma index until June but the escalation of events drove excess spreads up to around 100 bps. In mid-November the takeover failed spectacularly as the majority of PRGO shareholders rejected MYL’s offer. Although the rating agencies improved their outlook for both companies upon this news, excess spreads still remain in elevated territory today. As scale and consolidation are key driving forces in the generics drug space, there is a good chance that there will be future M&A activity around MYL and PRGO. It’s hard to predict whether they will act as acquirers of assets or if they themselves might come into focus as takeover targets of larger pharma companies. Consequently, bond investors demand higher credit spreads as compensation for uncertainty and event risk.
Going forward, rate hikes, and thus increasing funding costs, in combination with sincere efforts by US authorities to impede tax inversion transactions (i.e., where US companies use M&A with the main goal of relocating their legal domicile to lower-tax jurisdictions), could slow down the deal flow. However, M&A activity is likely to remain a major market theme for the foreseeable future. Many deals are struck to advance the interests of shareholders, which can collide with those of bondholders. As bond investors we need to concern ourselves with downside protection and ultimately we have to decide on a case-by-case basis whether bond valuations provide adequate compensation for M&A event risk around a certain company or business sector. But it’s not all bad news. Apart from the occasional outright credit-positive transaction, mergers can improve the long-term prospects of businesses for the benefits of all investors (although the upside potential for bondholders tends to be far smaller than for shareholders). New bond issues launched as part of deal financing, often at decent spread premiums over outstanding bonds, can provide appealing investment opportunities, particularly when the involved entities are committed to deleveraging after the transaction.
Full Disclosure: M&G is a holder of corporate bonds issued by Allergan, Celgene, Mylan Perrigo, Pfizer and Teva.
Here is the 9th annual Christmas Quiz. 20 questions, and the closing date for entries is midday on Thursday 24th December.
Please email your answers to us at bondteam@bondvigilantes.co.uk. The winner will get glory, and can choose a charity from our approved list to which we will donate £100. She or he will also get a copy of Morrissey’s atrociously reviewed novel, and “Bad Sex” award winner, “List of the Lost”. Four runners up will also get a copy of the novel, which is worth owning for the cover image alone.
Good luck! Conditions of entry are down below somewhere.


The closing date is Thursday 24th December at midday UK time.
This competition is now closed.


Sign up to the Bond Vigilantes mailing list to ensure you never miss a great article from our expert Bloggers. We will email all new articles to your inbox, meaning you can stay on top of the world of Bonds.
I confirm that I would like to receive information about Bond Vigilantes and products and services from M&G Securities Limited.
We will use the email address and personal data you have shared with us to send you this information. For existing customers, submitting your contact details and requesting to receive this information from us, will replace any earlier choices you have made in respect of marketing information.
You can unsubscribe from marketing at any time, at which point we will not send any further marketing information to you, by selecting the unsubscribe link in all communications.


