
Rolldown
A dispatch from the number crunchers – Yield curve rolldown
By Matthew Russell
15 April 2026

Professor Robert Gordon of North-Western University was in town this week to give speeches at Prospect Magazine (which is ace by the way) and the LSE. His latest book, “The Rise and Fall of American Growth” was released earlier this year, and is a tremendously powerful antidote to the wave of techno-optimism we might feel when we see shiny electric cars and gadgets coming out of Silicon Valley. Professor Gordon points out that mankind’s greatest period of technological innovation came between 1920 and 1970, and that since then it’s been a story of disappointment. As Peter Thiel put it, “we wanted flying cars, instead we got 140 characters”. Here’s my interview with him – after this and our previous interview with Martin Ford, pessimistic about technology for a different reason, we need cheering up. After you’ve had a look, please enter our competition. To win one of 5 copies of Bob’s book, answer this question, send your entry here bondteam@bondvigilantes.co.uk:
What was the name of the United States’ first electric power plant, built in Manhattan by Edison at the end of the nineteenth century?
Congratulations to the winners:
Mark Bohlund, Bloomberg
Mark Larsson, Johnston Campbell
John McLaughlin, Brewin Dolphin Ltd
Scott Farnetti, Barclays
Andrew Pedley, Barclays
The correct answer is – Pearl Street Station
This competition is now closed.
Chaori Solar and Baoding Tianwei will forever remain in the history of China’s bond market. In March 2014 the former became the first defaulter in the country’s onshore bond market whilst the latter turned out to be the first state-owned enterprise (SOE) default in China in April 2015. Since then, 24 other bond defaults occurred in the country, the majority of which in the manufacturing, metals and steel sectors, reflecting the country’s rebalancing act towards a service economy.
Around 90% of China’s corporate bond debt is denominated in local currency (Rmb) – the so-called onshore bond market. Two-thirds of this market is government-related debt. The remainder is corporates, of which 90% are SOEs. The IIF recently reported that it was the world’s third largest domestic market in value with a size of Rmb 48 trillion ($7.5 trillion) or 65% of GDP. Only the US $35 trillion (over 200% of GDP) and the Japanese $11 trillion market (250% of GDP) ranks in front of China. In principle, as a percentage of GDP, there is room for China’s onshore bond market to grow further. In practice, this is the tree that hides the forest considering that the country has a significant corporate loan problem with non-financial corporate debt of 125% of GDP. The very fact that there are increasing bond defaults in China’s onshore bond market – a relatively small universe composed of China’s blue chip companies – suggests that the main banks have been experiencing growing non-performing loan ratios.
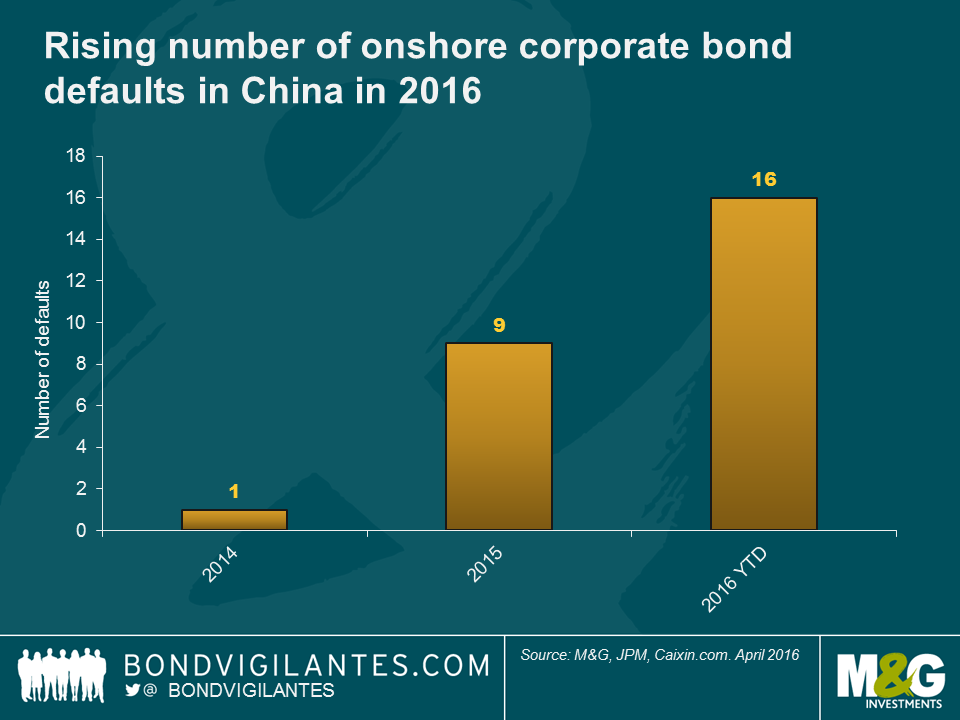
International bond investors would tend to see a rise in default rates as a natural healing process for China, allowing for greater credit differentiation. Therefore, one source of increased market concern is none other than the pace of corporate defaults this year and whether valuations do indeed reflect that risk. As can be seen in the chart above, there has been more corporate defaults in the onshore bond market year to date than in the previous two years. Another source of concern is the uncertainty about whether the government will continue to support state companies – which represent a large share of the onshore bond market. Back in September 2015, the Chinese government created two segments of SOEs: “Public Welfare Providers” and “Commercial SOEs”, raising questions about whether the latter segment would receive less extraordinary government support than anticipated by market participants – a huge change in local investors’ perception. Furthermore, the recent opening of the onshore market to international investors (they currently account for just 2%), albeit positive in the long term, is likely to bring greater credit differentiation across the onshore credit curve as new investors will have a broader benchmark universe and we could see the arrival of covenants in domestic bond documentation.
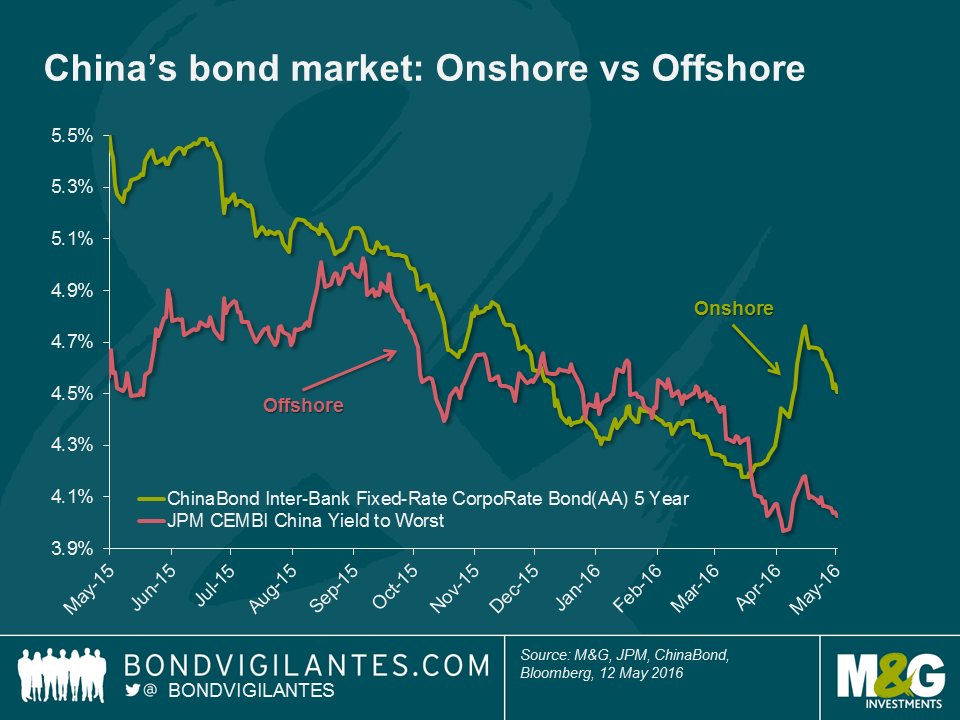
In theory, China’s softer economic environment and greater default risk should have pushed onshore bond market yields higher. The reality is quite the opposite. Corporate bond yields have declined materially in 2015 fuelled by rate cuts and private bank incremental bond buying after the stock market collapse. This decoupling of fundamentals relative to valuations was similarly observed in yields for US dollar-denominated bonds issued by Chinese corporates which, over the course of 2015, performed extremely well thanks to supportive market technicals, and despite deteriorating fundamentals (i.e. softer macroeconomics, asset quality deterioration for banks, oversupply and lower growth rates for property developers, higher leverage of a number of SOEs, etc.).
The attractive cost of funding in renminbi has been a positive technical backdrop for China’s offshore corporate bond market, which includes a large number of property developers. These issuers took advantage of the low yield and surprisingly high rating of the onshore market to refinance their US dollar bonds – enabling them to reduce FX mismatches on their balance sheets. For instance, in 2015 Chinese real estate developer Evergrande issued a CNY 5 billion onshore bond with a yield of 5.38%, which was locally rated AAA by the Chinese rating agency Dagong. Evergrande’s US dollar bonds (yielding above 8% for shorter maturities) are currently rated B3 and CCC+ by Moody’s and S&P, respectively. It is therefore easy to understand why property developers rushed on the onshore bond market for funding. As a result, the supply of US dollar bonds issued by Chinese corporates diminished whilst, in parallel, local investor demand for US dollar bonds remained high due to RMB bearishness and poorly performing equity markets.
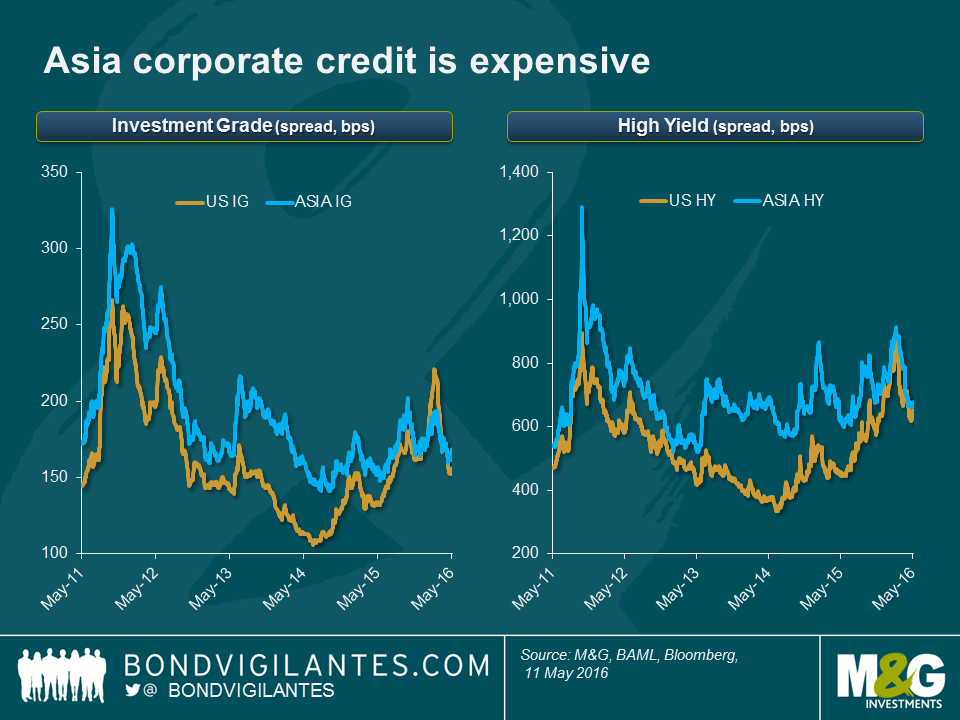
From a global investor’s perspective, this has resulted in a quite unattractive valuation point for offshore bonds. First, emerging markets bond investors may find higher bond yields outside of China, offering both a carry play and capital appreciation upside on credits with strong fundamentals – especially those that were unduly punished by the negative sentiment towards the asset class as a whole. Second, the repricing of corporate bonds in developed markets, notably in the US, makes Chinese US dollar bonds very expensive, especially bearing in mind the subordination risk (to domestic bonds) born by offshore investors in China. The following chart provides good evidence of tight valuations in Asia (of which a large share is China) versus US investment grade and high yield credits.
If China’s onshore default rates continue to increase at the current pace – which is very likely – and we witness an expected rise in onshore bond yields, there is a real risk of Chinese issuers turning down the onshore bond market to tap the offshore market. This would increase supply of US dollar bonds and put an end to the positive technical backdrop in terms of supply. Removing the technical aspect, fundamentals will catch up – as they always do – in the long run. On top of higher leverage resulting from a weaker macro, increased US dollar issuance will generate higher currency risk on balance sheet assuming some degree of depreciation of the RMB going forward. It will then only be a matter of time before the offshore bond market re-prices. The repricing should be uneven and US dollar high yield bonds would be most at risk with demand from local private banks and international investors turning to the better quality credits in a market where low yields no longer compensate for the greater default risk.
Earlier this week Richard Woolnough wrote a blog about negative rates and tax on interest. In it he also suggested that once the ECB stops printing the €500 note and ends issuance of its existing notes at the end of 2018, the legacy notes will trade at a premium. The argument is that because the notes will remain legal tender across the Eurozone, demand for a note with the lowest storage costs and easy portability will outstrip the limited (now finite) supply. He suggested that if you wanted to get hold of one, you might have to pay, say, €501, for the privilege. This led to a debate in the office – I thought that the reverse might be true. Whilst supply is capped, perhaps demand might fall substantially. It’s been suggested that a significant portion of the €300 billion (30% of the total notes in circulation) of those large denomination notes are held as the proceeds of crime, or for tax avoidance purposes. One of the stages of money laundering is called “integration” – in other words turning illegally held cash into legitimate bank accounts or assets. In a world where everybody knows it is no longer possible to obtain €500 notes, does attempting to use them in such a transaction act as a big signal that this person might be a criminal or tax avoider, and lead the suspicious to call the police or tax authorities? Might there therefore be an attempt by holders to turn them into “current” notes, like the €200 – or even to move into the CHF 1000 note in Switzerland? So I reckon that the €500 note should trade at a discount to face, as holders try to move out of a less liquid asset.
Anyway, we thought it would be a good idea to have a Twitter poll to see what people thought (and to experiment with our first poll). The results are in. We had 190 votes, and it seems like I’m in a minority. 50% of you agreed with Richard – they’ll trade at a premium.
The @ecb is stopping printing the €500 note. They’ll become scarce, but have crime/tax taint. Will legacy €500 notes
— Bond Vigilantes (@bondvigilantes) May 10, 2016
There has been much discussion recently that by introducing negative rates central banks are effectively taxing savings. This is self-explanatory, and is one of the criticisms of how negative rates can distort economic behaviour. This however is not a new phenomenon. Let’s not forget that money has always been effectively clipped by the traditional enemy of savers – inflation. Fortunately, holders of cash have traditionally been compensated for depositing it in a bank account by receiving interest payments. But is this something that is now at threat with negative rates?
If you take the Bank of England rate as a proxy for the interest earned on cash and adjust for inflation (i.e. subtracting RPI from base rates), although negative nominal interest rates are a new phenomenon, real negative rates are not. If we expand this thinking to include the historic rate of basic income tax, we can attempt to fully depict what can be considered the real rate of return on cash. This gives a more accurate reflection of what savers have actually earned in real disposable income per annum and as you can see from the chart below, this has been negative in the UK for much of the past ten years.
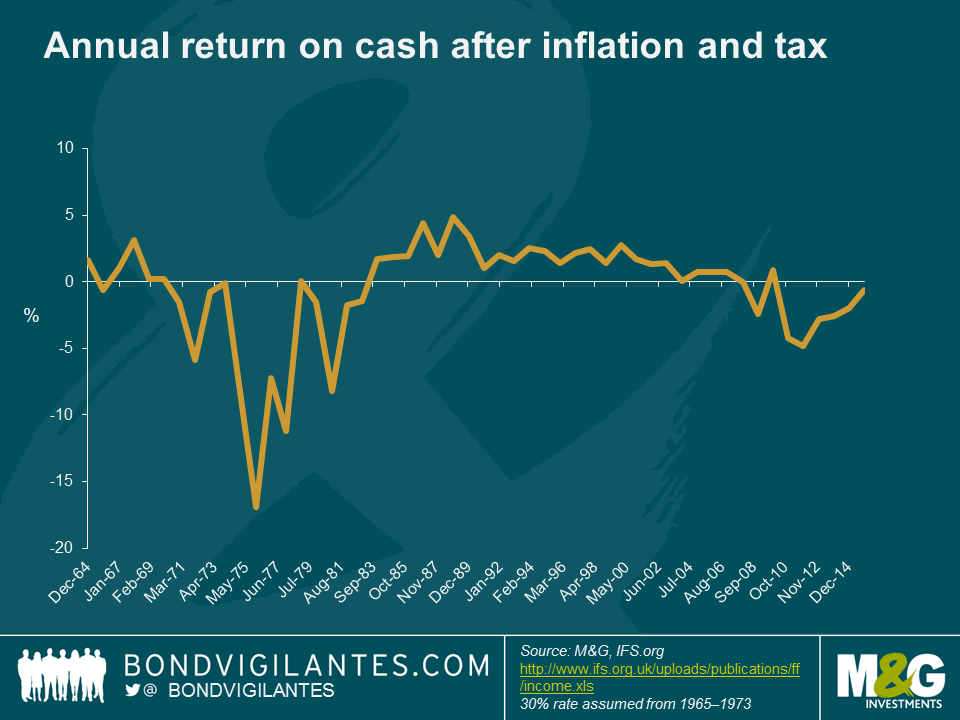
Given the recent outcry regarding the effect of negative rates on savers one has to believe that they are suffering from the economic concept of money illusion. This ‘savers illusion’ is a function of them focusing solely on the nominal rate and ignoring the true level of return after inflation and tax. (Remember that negative interest rates are more likely to occur in a deflationary environment, so it is still possible to earn a positive real return).
Focusing at the extreme and the 45% highest tax rate, the table below helps to illustrate the real return to these savers in various interest rate and inflation rate scenarios. As one would expect, high nominal interest rates and low inflation are beneficial for savers at all tax levels.
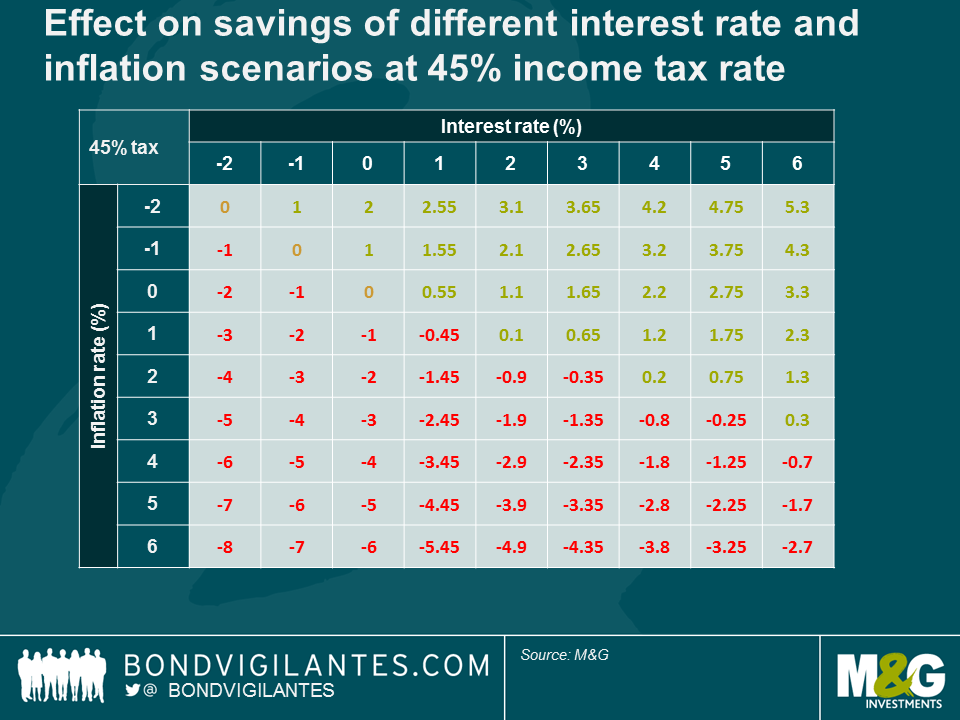
But one of the most interesting results occurs at zero or negative rates. The tax rate of the saver becomes irrelevant at this level; as no income is generated, no income tax can be levied. Also, although the tables illustrate a negative rate, in reality savers can get around this by holding physical cash. This is something we have talked about before, along with the elimination of currency and the nature of cash. Negative and low nominal interest rates are new, low and negative real returns both pre and post tax are not.
And whilst we are on the subject of eliminating cash it’s worth noting the ECB’s announcement about stopping printing the €500 note. By taking this action the ECB is recognising an antisocial demand for its notes (tax evasion, crime), although there remains a strong suspicion that it’s also because cash storage disrupts the transmission mechanism of monetary policy at negative rates. The ECB has, however, allowed the notes to continue to be legal tender, and presumably demand for the note will still be strong. If that’s the case could we see the €500 note trade at a premium? If so, what would that premium be? There must be some calculation based on the additional storage costs incurred by hoarding cash in lower denomination notes?
To date the defaults we’ve seen in the US high yield market have largely occurred in the energy/commodity sectors. To see whether this trend is likely to persist I spent some time comparing the current default cycle with that of the US telco sector in the early 2000’s (see also James’ recent blog for the parallels between today’s high yield market and that of 2001).
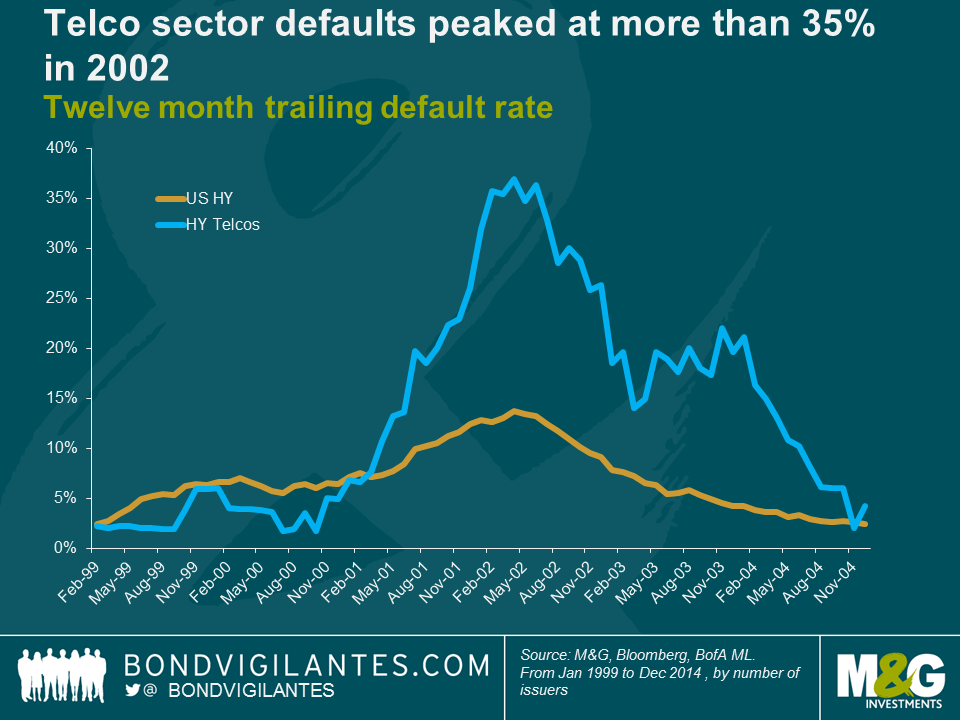
The telco bust occurred slightly later and was around ten times larger than the better-remembered dotcom bust. Following the industry liberalisation in the 1990’s firms in the sector built up about $1tn of debt. This debt was used to finance the construction of huge networks which, as it turned out, there was not enough demand for. Defaults began to pick up in early 2001 and peaked around twelve months later with more than 35% of high yield telcos defaulting as seen in the chart below.
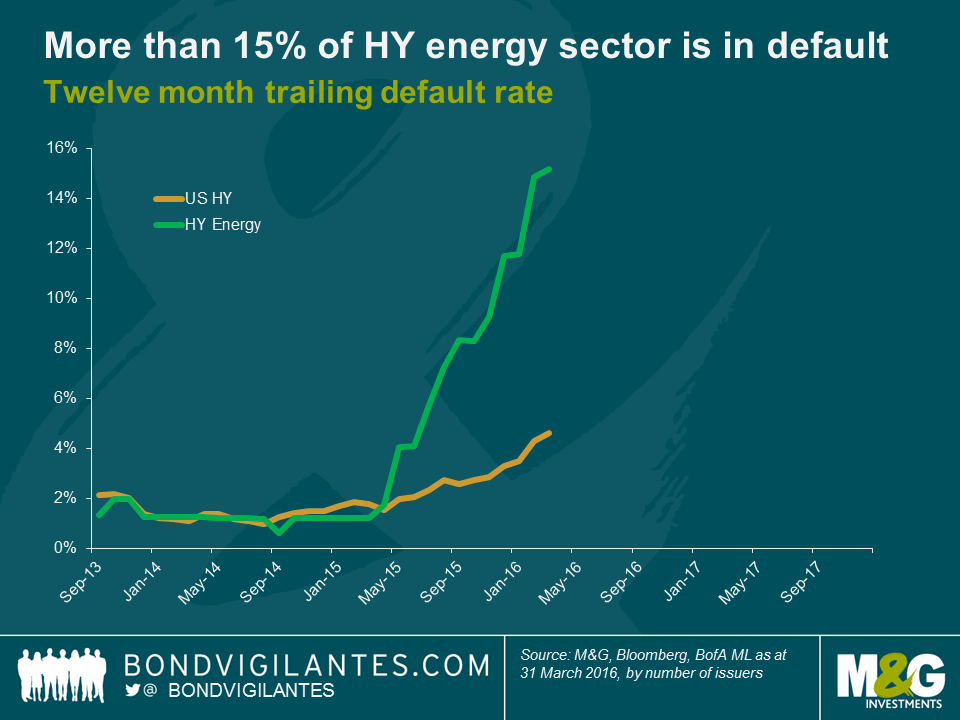
The default cycle in the US energy sector began around a year ago and as at the end of March the proportion of US high yield energy firms in default stood at 15.2%, according to Bank of America Merrill Lynch. There have been 52 defaults over the past year in the US high yield market, of which 26 have been in the energy sector. This represents a much larger proportion of total HY defaults (50%) than did the telco sector at its peak in 2002 (below 30%).
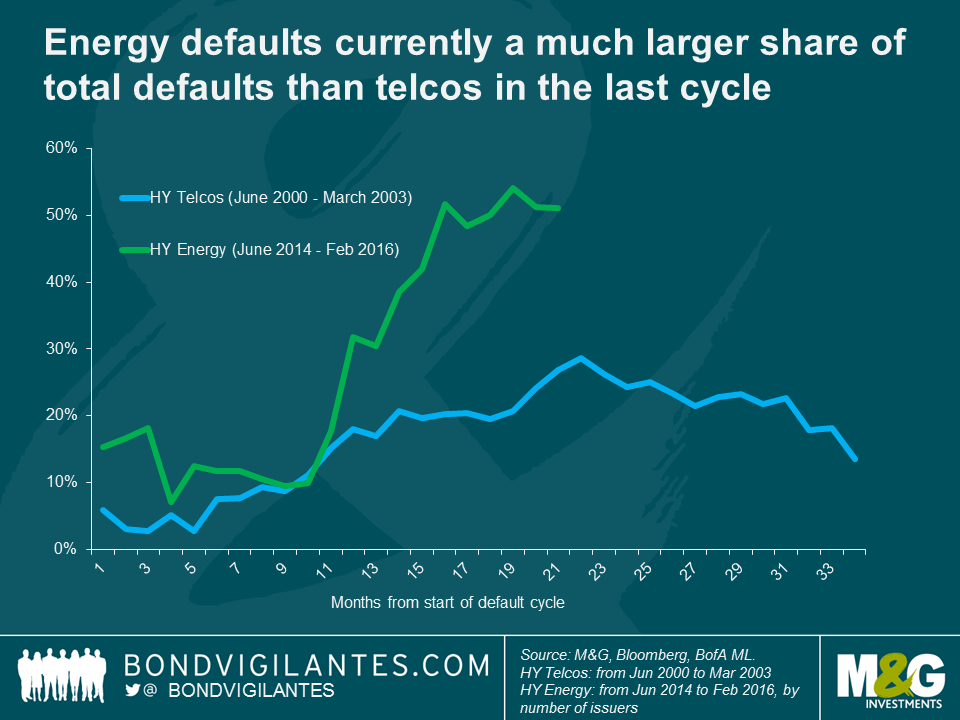
Currently the HY default cycle in the energy market is less severe and a lot more concentrated than it was in telcos at the turn of the millennium. That’s not to say that there isn’t more pain to come, but my intuition is that any significant increase in defaults will likely be constrained to the energy/commodity space.
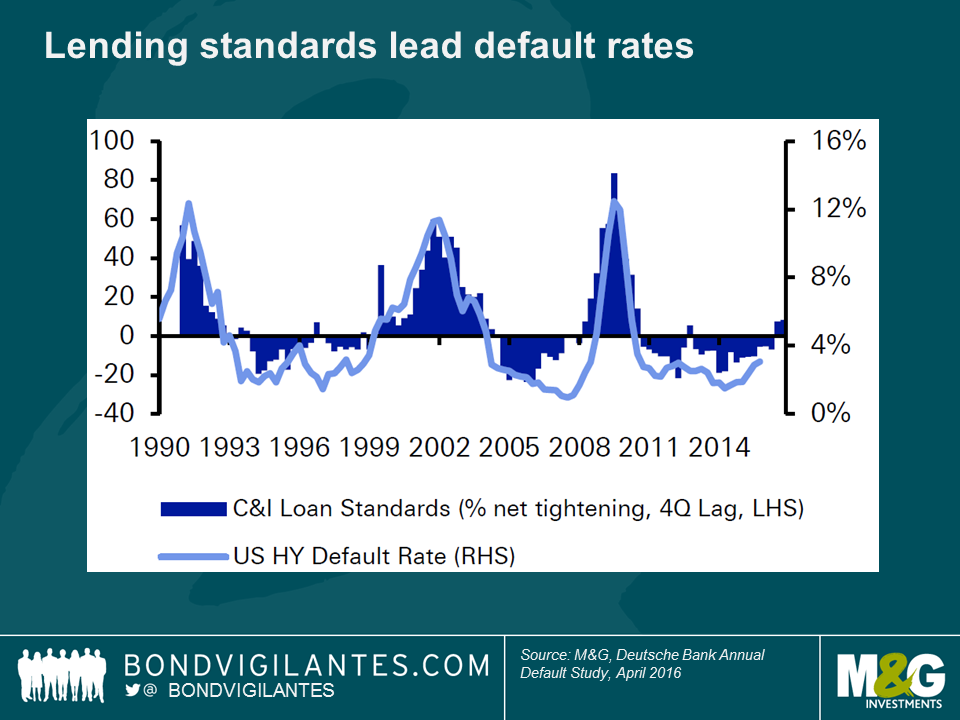
The chart below, shamelessly borrowed from the ever illuminating Deutsche Bank annual default study released earlier this month, predicts a pickup in defaults due to a recent tightening of lending standards. Historically, tighter lending standards (including higher interest rates) have led to a pick up in the HY default rate around a year later and two consecutive quarters of tightening (as we have just experienced) have always led to a significant rise in defaults. Even though lending standards have tightened recently I would make a couple of observations. Standards are tightening following a number of years of being extremely loose and from record low interest rates. Therefore we are coming off a pretty low base. Also, given the lag between tighter standards and higher default rates, a significant rise in default rates could still be some way off.
Finally, and the main reason I don’t see the stress in the energy and commodity sectors translating into more widespread defaults, is that the stress in these sectors has been caused by low oil and commodity prices, which should be positive for other sectors of the high yield market. It’s certainly possible that defaults in the energy sector could affect confidence and spill over into the wider high yield market, which could be one reason we’re seeing tighter lending standards, but on balance I struggle to construct a scenario in which the falling cost of a factor of production harms business. How can lower input prices do anything other than help the profit margins and free cash flow of firms in the wider economy? The lower oil price should also feed through to higher disposable incomes for the main driver of the US economy – the consumer.


Sign up to the Bond Vigilantes mailing list to ensure you never miss a great article from our expert Bloggers. We will email all new articles to your inbox, meaning you can stay on top of the world of Bonds.
I confirm that I would like to receive information about Bond Vigilantes and products and services from M&G Securities Limited.
We will use the email address and personal data you have shared with us to send you this information. For existing customers, submitting your contact details and requesting to receive this information from us, will replace any earlier choices you have made in respect of marketing information.
You can unsubscribe from marketing at any time, at which point we will not send any further marketing information to you, by selecting the unsubscribe link in all communications.


