


Which corporate bonds has the ECB been buying?
Having recently blogged about the potentially eligible universe of the Corporate Sector Purchase Programme (CSPP), we were naturally eager to find out which corporate bonds the European Central Bank (ECB) has actually been buying. On Monday, the ECB eventually published the highly-anticipated list of their bond holdings.
Except that’s not what happened. Instead of the ECB releasing a neat consolidated list, each of the six national central banks carrying out the bond purchases disseminated their statements separately on the ECB’s webpage. Apart from the blatant lack of integration, they didn’t appear to be overly concerned with consistency either (see below). In fact, they took inconsistencies to almost comic levels. Most banks chose to only state International Securities Identification Numbers (ISINs), presented in a variety of layouts. The German Bundesbank, being a stickler for details, felt the need to go above and beyond by additionally mentioning security and issuer names – Dankeschön. Banco de España did not consider it necessary to provide an English language version of their document – No importa. The other banks did, even the proud Banque de France, which however didn’t release any security identifiers on the ECB’s webpage but kindly told interested readers to do their own research on Bloomberg – Incroyable!

Before diving into the analysis, it is important to point out that we only know the total volume of purchases – EUR 10.43 billion between 8th June and 15th July – and the identity of the 458 corporate bonds that have been bought in this period. But we do NOT have the portfolio weights. The average position size is EUR 22.8 million but the dispersion around the mean is entirely unknown. To give an example, Deutsche Bahn is the most popular issuer in terms of ISIN count: 12 of their bonds have been purchased, which puts them ahead of Telefonica (11) and BMW (10). But without knowing the size of the holdings we cannot compute weighted averages and are thus unable to draw any firm conclusions with regards to the actual risk exposure towards Deutsche Bahn.
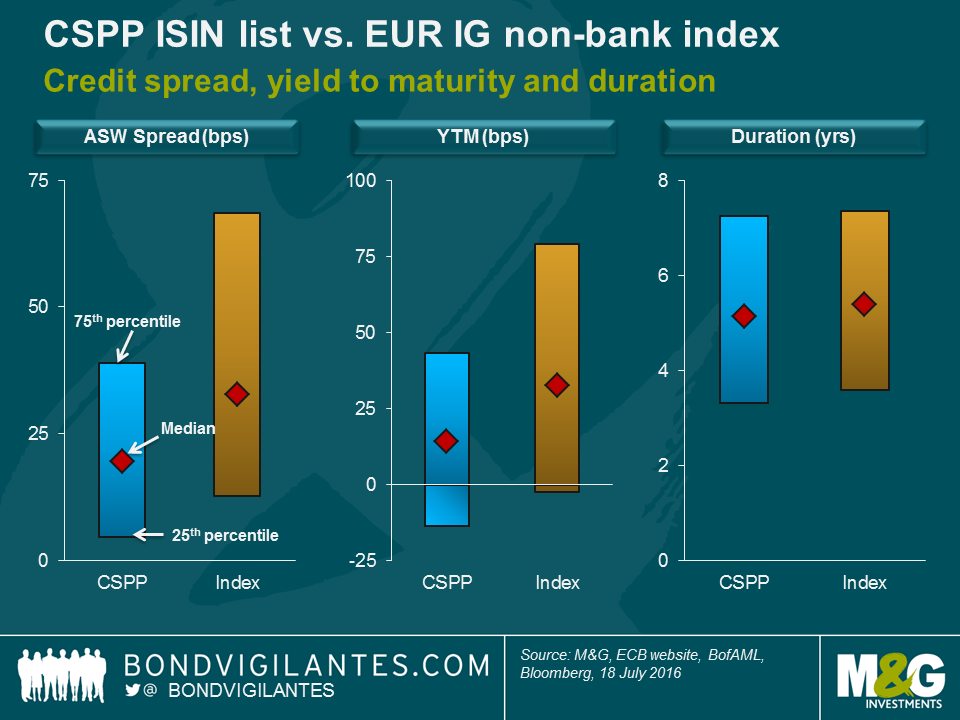
Nonetheless, we can apply basic percentile analysis to get a better understanding of the ECB’s corporate bond holdings. The median asset swap (ASW) spread and median yield to maturity (YTM) of the CSPP holdings are 20 bps and 14 bps, respectively. In comparison, the corresponding median values of the EUR-denominated investment grade (IG) non-bank index, a crude proxy for the eligible bond universe, are both above 30 bps. The middle 50% of CSPP spread and YTM values (i.e., from the 25th to the 75th percentile) are less dispersed and shifted to lower values, compared to the index. Remarkably, more than a third (c. 36%) of the CSPP bonds are currently trading at a negative YTM. This is an indication that the CSPP holdings might be more defensively positioned than the index, but as mentioned before we do not know the portfolio weights. In terms of duration, CSPP median (5.1 years) and dispersion are very close to the index.
We also dissected the CSPP list further by country of risk, industry sector and composite credit rating (see chart below). Although French companies have far more ECB eligible debt outstanding than German firms, the ISIN count is pretty much neck-to-neck. Both countries account for around a quarter of the list. Only 3 bonds from U.S. issuers have been purchased, which is far less than for Swiss (17) and British (7) corporates, the other non-Eurozone countries on the list. Bonds of these companies are ECB eligible as long as they are issued from legal entities established in the Eurozone and fulfil further criteria (Euro-denomination, IG rating, etc.). Considering the sizeable amounts of eligible bonds from U.S. firms, they seem to be underrepresented. But again, at the risk of sounding like a broken record, since position sizes are unknown we simply don’t know for sure whether the ECB is really “underweight” with regards to French or U.S. corporates.
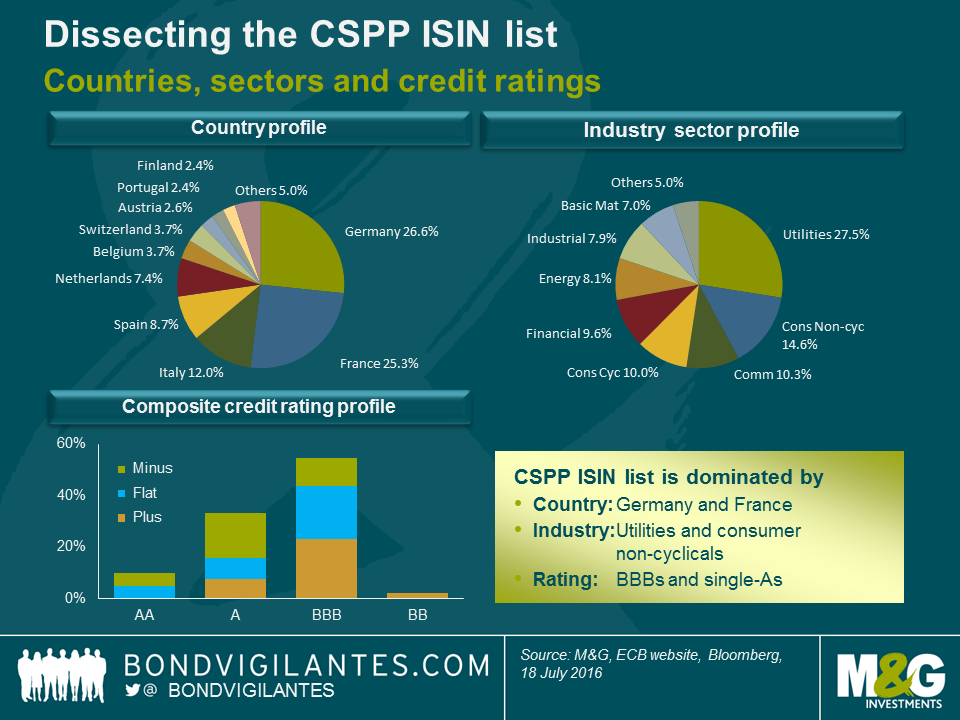
In terms of industry sectors, utilities (28%) and consumer non-cyclicals (15%) dominate the ISIN count. This is not at all surprising as the share of these sectors within the ECB eligible bond universe is similarly large. Likewise, the credit rating distribution (55% BBBs, 33% single-As) is broadly in line with the eligible universe. It is worth highlighting that the ECB made use of the loose IG eligibility criteria (a single IG rating from Moody’s, S&P, Fitch or DBRS is sufficient) and bought bonds of a couple of cross-over names with sub-IG composite ratings (e.g., Telecom Italia and Lufthansa).
In summary, there are definitely a number of interesting lessons to be learnt from analysing the CSPP ISIN list. But as tempting as it may be to draw conclusions regarding over- and underweights and thus to anticipate the ECB’s future buying activity, we have to acknowledge that we are simply lacking data. Trying to “front run” the ECB is therefore a highly difficult, if not impossible task.
The value of investments will fluctuate, which will cause prices to fall as well as rise and you may not get back the original amount you invested. Past performance is not a guide to future performance.
19 years of comment
Discover historical blogs from our extensive archive with our Blast from the past feature. View the most popular blogs posted this month - 5, 10 or 15 years ago!


Bond Vigilantes
Get Bond Vigilantes updates straight to your inbox