
Rolldown
A dispatch from the number crunchers – Yield curve rolldown
By Matthew Russell
15 April 2026

1. On the face of it, long term US Treasury yields are looking fair value, having traded on the dear side since the middle of 2014. Below is a chart you will have seen before on the blog as I’ve been using it for some time. It shows the relationship between the Fed’s long term expectations of short term interest rates (taken, with a pinch of salt, from the FOMC’s dot plots) and the bond market’s expectation of the 10 year US Treasury yield in 10 years’ time. In both cases, we are ignoring the immediate economic ups and downs, and even the possibility of an eight year Trump presidency.

Since the US election, the Treasury market has moved to price in a term premium of over 50 basis points and is arguably “cheap” compared to the median FOMC member’s long term Fed Funds expectation. Are there reasons why this simple model could be wrong? Of course there are. The term premium might not be sufficient, perhaps because of the “Chinese demand” factor I discuss below; and the FOMC and markets might significantly revise their expectations of the long term Fed Funds rate higher. After all, it’s come down from a median of 4.25% in 2012. If Trump is serious about a 4%+ real GDP target then it will head back there.
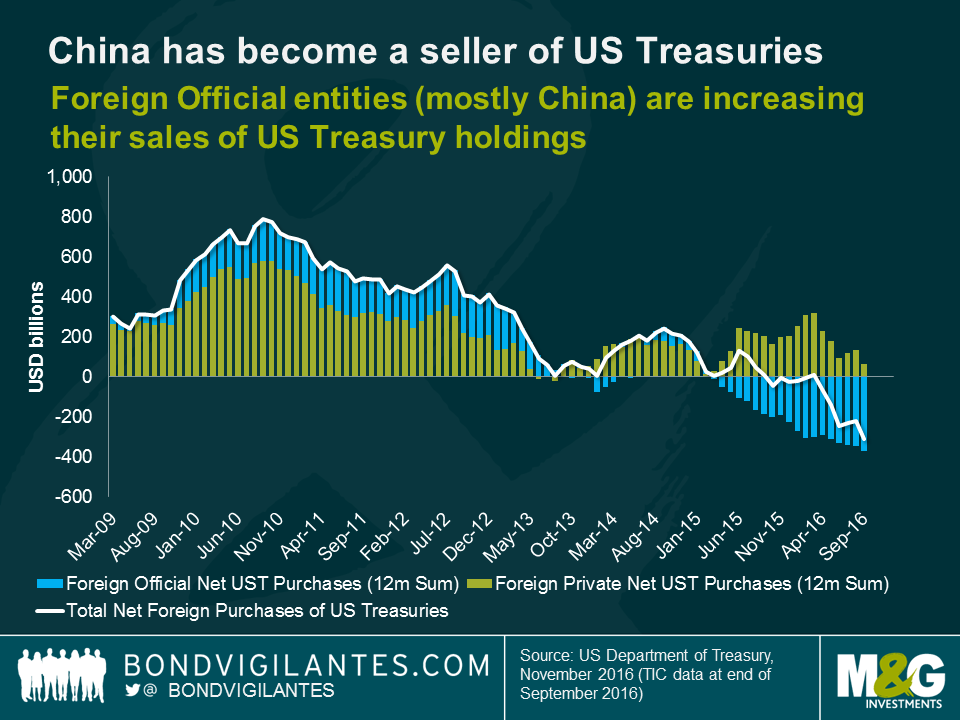
2. China joined the World Trade Organisation (WTO) at the end of 2001. Since then it’s accumulated, at peak, $4 trillion of foreign exchange reserves as a result of its trade earnings. Much of this ended up in the US Treasury market – China owns 20% of the market, with Japan owning another 20%. One estimate suggests that China’s purchases alone resulted in the 10 year Treasury yield trading 50 basis points lower than it otherwise would. However, the chart below shows that since the Chinese slowdown began in 2012, they have moved from being net buyers of US Treasuries, to net sellers. Additionally, since the start of 2016 foreigners as a whole have become net sellers of Treasuries. What was once a powerful tailwind for the Treasury market for the decade prior to 2016 has become a headwind. Perhaps a higher term premium is therefore appropriate.
3. Another headwind for US Treasuries is the cost for foreigners if they buy and hedge American bonds. Negative rates and ultra-low bond yields in Europe and Japan have left investors struggling to achieve yield targets (for example insurance company guarantees). On the face of it, a 2.5% 10 year US Treasury yield looks attractive if the alternative is a 0.5% yield on a 10 year German bund. Unfortunately, the weight of capital attempting to buy Treasuries out of Europe (and Japan) and then hedge the foreign exchange risk means that the “fx basis” (the supply and demand overlay to the fair value hedging cost assumption based on relative interest rates) is high. For Japanese investors the basis is -50 basis points and for Europeans it’s -35 basis points. This means that for a hedged investor in Japan the yield on the 10 year US Treasury is actually 0.55% and for Europeans it’s 0.46%. Whilst the negative basis isn’t as big as it was around the end of 2016 (-90 basis points for Japan and -60 basis points for Europe), it still doesn’t make sense for European investors to add to US Treasury positions in the hope of gaining a yield pick-up. Japanese investors now do achieve a premium once more, following the narrowing of its basis.
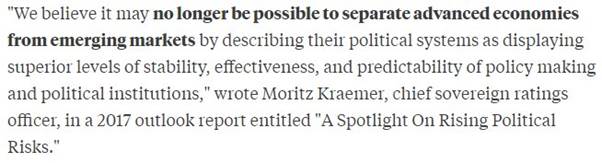
4. I didn’t spot this at the time (December), but Tracy Alloway of Bloomberg reminded me yesterday of S&P’s 2017 outlook piece by the excellent Moritz Kraemer. This quote from the document is chilling, if perhaps overdoing the collapse in the democratic and legal institutions that historically gave developed economies a ratings advantage over the emerging market nations.
5. I love a good “driverless cars” story. 94% of car accidents are caused by driver error. 32,000 lives are lost as a result in the US every year. 1 in 5 organ donations result from car accidents. If driverless cars are (presumably) better at driving than humans, then the shortage of donor organs is going to rise significantly. Another good “driving” story: for every 1% rise in unemployment US, 5000 fewer Americans die, as downturns keep especially dangerous drivers off the road. There is an obvious point that lower economic activity means that people drive (and can afford to drive) less. But the biggest decline in driving when growth slows, comes from the worst drivers. You can read some of theories in the article.
6. This National Institute of Economic and Social Research (NIESR) paper by Dr Monique Ebell is worth a read to understand the impacts on UK trade if we leave the single market. Dr Ebell estimates that the long term impact will be a fall in UK trade of up to 30%. The UK could experience an increase in trade with some countries – if the UK got a Free Trade Agreement with all of the BRICs then trade would rise by 2%, and an FTA with the Anglo-American economies would boost trade by just under 3%. Unfortunately, neither increase would make much of a dent in the drop in EU trade of 35%. Ouch.
7. The collapse in Trade Union membership continues, despite the rise in populism and rising anger at the weak income growth in the working and middle-classes in the developed world. Only 10.7% of Americans are union members, down from 11.1% two years ago, and 20% in the 1980s. The number of union members in the manufacturing industry has fallen by over 50% since 2000. Whilst I can see US wage growth hitting an annual rate of 3% later this year, it’s hard to see this becoming a sustained rise, especially in light of a relatively low participation rate in the US (compared with pre-GFC levels).
8. Duncan Weldon’s blog about The Second World War is good. Do we focus too much on the victory in battle, and not enough about how the UK won the peace?
9. China economist Michael Pettis is ace. Not only is he popping up at every economics conference I attend, anywhere in the world, but he’s popping out of my radio on a Sunday morning talking not about Chinese state-owned enterprises, but about the Chinese punk music scene. He asserted on BBC Radio 6 Music’s Mary-Anne Hobbs show that in a cultural history of the 21st century, Chinese alternative music of a decade ago will be one of the most significant movements. I’m sceptical, but UK readers can make up their own minds and “listen again” through the link above.
10. My favourite book to come out of the Great Financial Crisis was “This Time is Different” by Carmen Reinhart and Ken Rogoff. The authors demonstrated that nations which saw public debt to GDP ratios near 100% experienced significant growth slowdowns. There was some great economic history in a very readable book. I have started wondering though, in a world where growth has been sub-par for most of the developed world, whether this book was responsible for an “austerity meme” which has caused big damage to the global economy (and the subsequent political instability). We know that Keynesian responses to a demand shortfall work (discuss…) – so did this book result in the opposite happening in the UK under Osborne, or in Europe where Germany is running budget surpluses? How important was it in helping to create the low growth world that we’re now in?
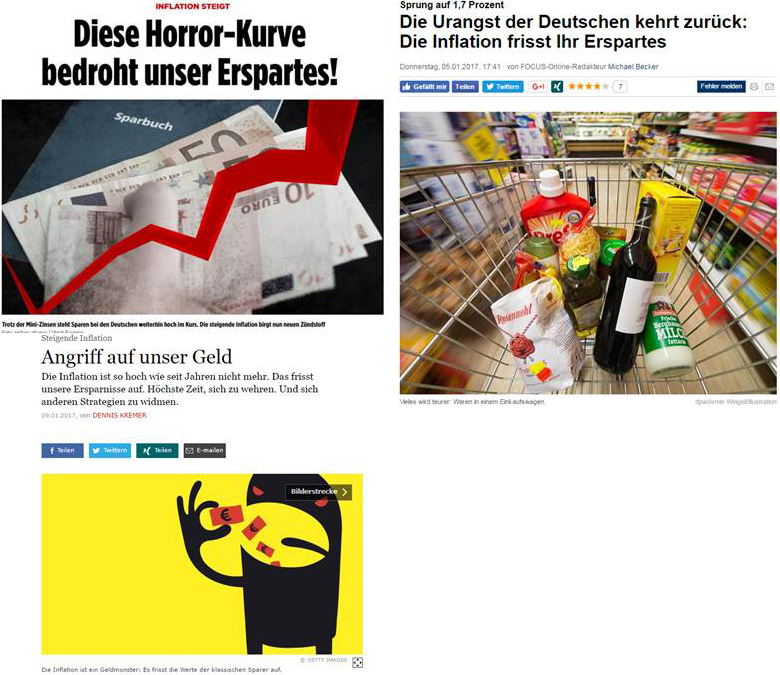
11. Talking of Germany, here are some newspaper articles from the past few weeks (Bild, Focus, FAZ) about German inflation edging back towards 2%. They are worried…
12. Finally, I’m in no way blaming our new(ish) CEO Anne Richards for the death of the weasel in the Cern Large Hadron Collider. It looks as if Anne left Cern before the stone marten was slayed with accelerating particles. Anyway, the stuffed Cern weasel is now available to be gawped at in Rotterdam if you want to see it. I am however staying away from all large electrical devices in M&G HQ for the foreseeable future. This included my Bloomberg terminal for two days last week when a vicious papercut and battlefield dressing (a plaster) meant that I was unable to get past fingerprint authentication…I had a great two days.

Join us on Bond Vigilantes TV, where this week we discuss:
We will also discuss upcoming events for the week in the economic calendar. Tune in!
President Trump’s anti-Mexico rhetoric has made Mexican assets one of the key calls in emerging market debt. I have just returned from a research trip to Mexico where I met with local economists, analysts, and corporate bond issuers. Below are a number of observations from my time there.
Donald Trump won the election on a fairly protectionist rhetoric – with a special focus on Mexico – and the pressure to fulfil electoral promises (unlike most seasoned politicians) is therefore likely to see the implementation of some of the things he has proposed. Whilst the intentions are clear, the measures that he will implement to satisfy his electorate are more uncertain. Despite the symbolic nature, building a wall at the Southern border of the US would have a limited impact on the Mexican economy. However, other policies that Trump supports may have a significant impact on the economy and asset prices:
(i) Border adjustment: Trump has promised fiscal reform with US corporate tax being lowered to between 15% to 20%, from 35%. The new corporate tax could be based on the location of consumption, meaning imports would be taxed at 15% to 20% while exports would see a full or partial exemption in tax. Trump seems to prefer pure tariffs between trading partners, rather than allow this discrepancy on the application of the new corporate tax rate to occur.
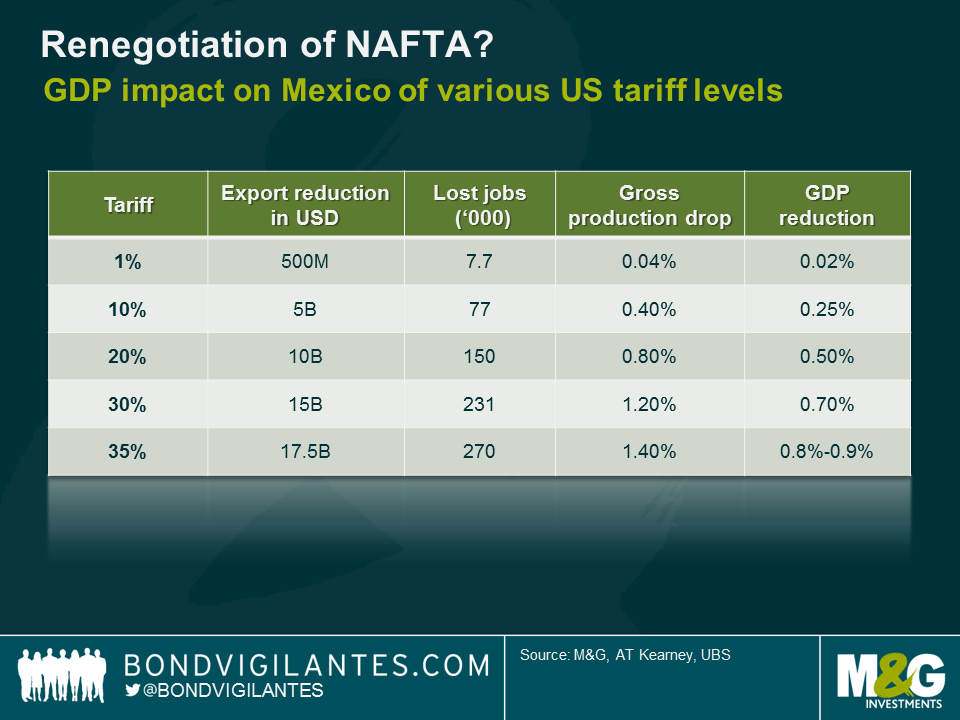
(ii) Tariffs: Mexico’s exports to the US account for 80% of the country’s total exports. Goods and services traded under the North American Free Trade Agreement (NAFTA) account for approximately 25% of GDP. Under NAFTA, there are no tariffs for exporting qualifying goods to the US. Putting in place any sort of tariffs would mechanically hit hard the Mexican manufacturing industry and in particular the auto-part sector. As can be seen in the below chart, a 35% tariff would result in a c. 0.8% to 0.9% reduction in Mexico’s GDP – just as a primary effect, i.e. without considering the collateral damages such as investment, consumption, etc. Given that Mexico is expected to grow at between 1 to 2% this year a 35% tariff could lead to a recession. At 35%, however, this level of tariff would imply a breach of the NAFTA and the US exiting the World Trade Organisation.
(iii) Taxing remittances: Cash sent by legal and illegal Mexican immigrants from the US to Mexico accounts for 2% of GDP. Trump has threatened to tax and block money transfers. A vast majority of people I met in Mexico think this measure is unrealistic because it presents many constitutional issues for the US and immigrants will always find a way to send money (e.g. through friends).
(iv) Other measures such as security and sanitary trade barriers: these non-tariff measures, which don’t require Congress approval, would most affect sectors such as Mexican agricultural products.
Unfortunately for Mexican government officials, their negotiating position is weak. Mexican officials have reportedly been sitting around the table with the Trump cabinet for weeks, if not months. The Mexican government has been moving key personnel around in order to attempt to get the best deal with the US that it can. The Mexican Finance Minister, Luis Videgaray, who invited Trump to Mexico in September, has now become Mexico’s Foreign Affairs Minister (mainly because of his good relationship with the new US President).
The problem is that Mexico has few levers to pull around the negotiation table. For example, threatening to open the country’s Southern border with Guatemala and let all immigrants go to the US appears unsustainable because obviously Mexico itself would not enjoy massive immigration from the other Central American countries. However, the argument that the economy of Texas – a large exporter to Mexico with more than 1 million jobs linked to exports – would suffer in a trade war could play in favour of Mexico given the large number of Republicans in Texas.
In my view, the most relevant argument is the mutual economic dependency between Canada, the US and Mexico, created by NAFTA. The auto industry, the most at risk from a NAFTA revision, is for instance highly integrated. The day after 9/11, the US closed their border with Canada for obvious security purposes. On 12th September 2001, not a single car was produced in Detroit. This is because the supply chain is highly integrated, and US original equipment manufacturers (OEM) in Detroit are reliant on auto-parts supply from Canada. Furthermore, having talked to auto-part manufacturers during my visit to Mexico, many have manufacturing platforms with an average lifespan of seven to eight years. This compares to a Presidential mandate of four years (or eight at best). US companies like General Motors or Ford are unlikely to abruptly interrupt existing contracts which involved prior investments. Likewise, a major increase in tariffs would result in Mexican companies passing through the cost on to US OEMs. Therefore, the US implementation of a 35% tariff is highly unlikely because US consumers would feel the pain very quickly when buying a new car. What OEMs and other US companies might well do is to suspend/cancel future investment plans. Early January, Ford cancelled a US$1.6 billion investment in a new plant in Mexico. Ford mentioned they would instead invest $700m into their existing facility in Michigan.
Looking at the bigger picture, it will certainly be a year of noise for Mexico. Noise (and tweets!) will bring uncertainty and uncertainty will almost inevitably adversely impact investments. Foreign direct investments (FDI) amounted to about $25bn last year and are now expected to drop significantly in 2017 as a result of the uncertainty surrounding the US protectionist rhetoric and NAFTA. Between 2008 and 2015, Mexico’s current account deficit was covered by FDI. Even though the deficit is not foreseen to increase, lower FDI pose the problem of how Mexico is going to finance its current account deficit going forward. Secondary effects of lower investment on unemployment and domestic consumption may also amplify the deterioration of the country’s credit profile. Add to the above potential outflows from local-currency government bonds (70%-owned by foreigners) and the picture looks increasingly grim.
In light of this backdrop, what’s priced in to current investment markets? The answer is almost nothing in the US dollar corporate bond market. As can be seen in the chart below, bond spreads of Mexican corporate issuers trade at around 300bps currently, down 10bps from the pre-US election level. Of course, some sectors such as tourism benefit from a weaker Peso but on the other hand a lot of companies, such as in the telecom sector, suffer from currency depreciation. As for the manufacturing and consumer sectors, they are highly dependent on the NAFTA and the reward in bond spreads does not reflect the risk of tariffs being put in place. If anything, bond spreads are already pricing in the upside of higher potential US growth driving increased trades with Mexico. Personally, I don’t share this optimism.
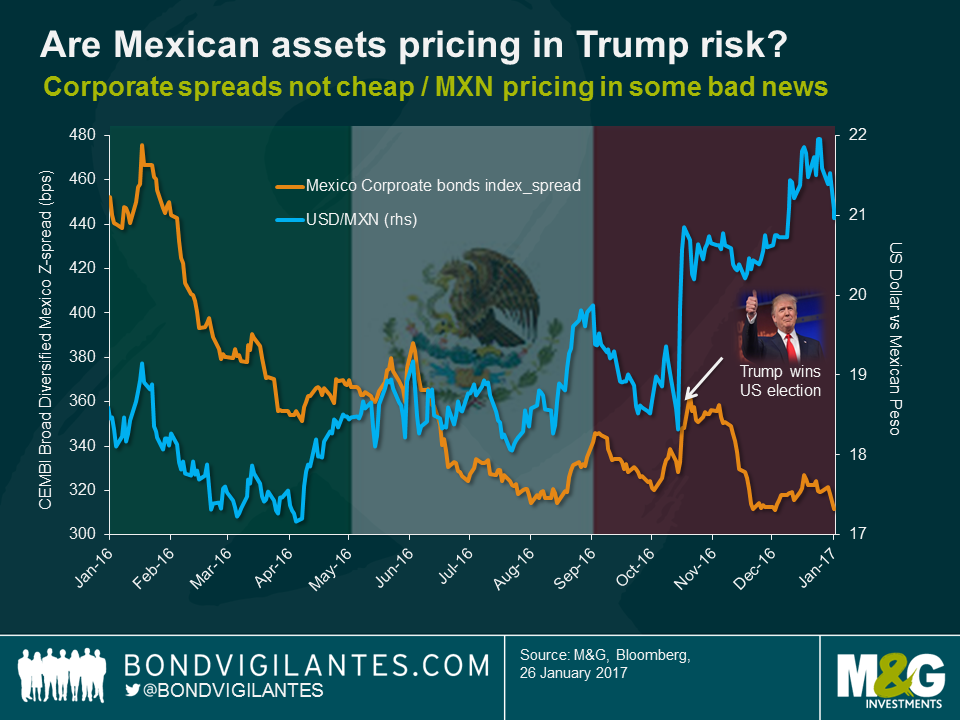
There is likely more value in the Mexican Peso which is pricing in quite a bit of bad news already. Is it pricing in a 35% tariff? Certainly not. But the currency has sold off versus the US dollar by more than 15% since the US election in November and, by making the Mexican economy more competitive for exports, seems to incorporate some degree of revision of NAFTA which is a sensible scenario.
From a global market perspective, how the new US administration reshapes its relationship with Mexico in the near future might well set the tone for even bigger matters – in particular the US relationship with China – making the Trump-Mexico trade a key call for most global investors.
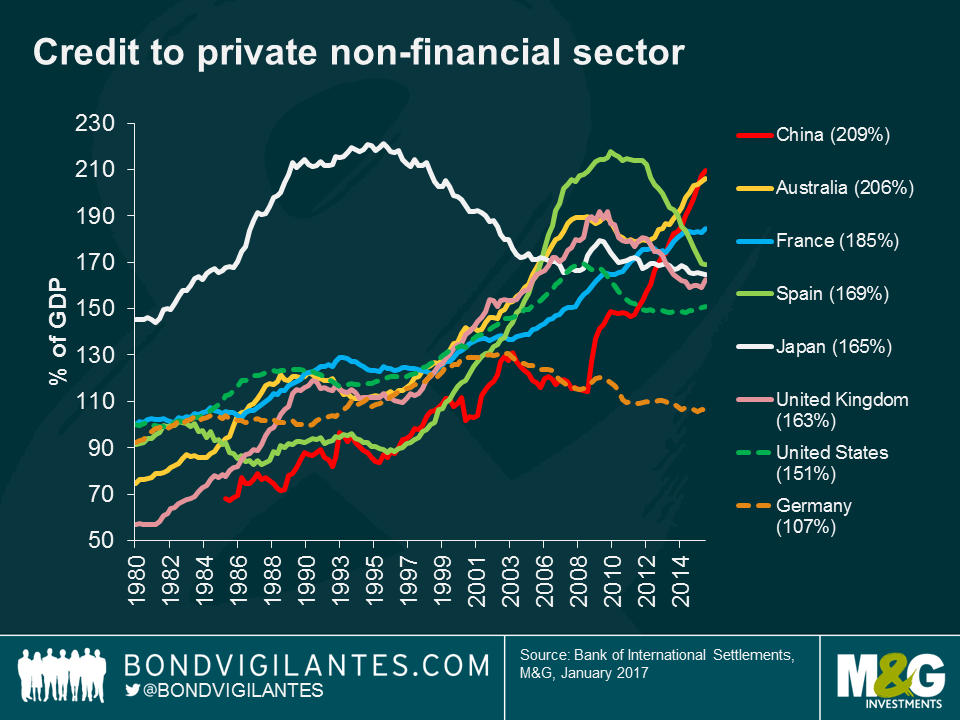
Credit is the oil that lubricates the engine of an economy. For this reason, economists watch credit statistics closely, in order to assess the sustainability of growth. If credit isn’t growing, it suggests households and firms aren’t confident enough in their respective outlooks to borrow and invest. If credit grows too quickly, it could result in financial and macroeconomic instability – history shows that banking crises are usually preceded by a large and quick build-up of credit in the private sector.
The chart below shows the level of total credit to the non-financial private sector as a percentage of GDP for some of the world’s largest economies. Importantly, this measure from the Bank of International Settlements includes credit from domestic, non-bank, and foreign lenders. Whilst there is no level of credit-to-GDP that will result in financial instability, the chart does show that Chinese and Australian debt ratios are nearing the peak ratio seen in Japan (221%) in the 1990s and Spain (218%) in 2010. Interestingly, China’s household debt-to-GDP ratio, which is incorporated into these numbers, at 42% is much lower than Australia’s at 123%.
Economists become concerned when credit growth departs from its prior trend. In this sense, what the debt is used for is important. For example, if a loan from a bank is used to purchase a new car, it will lift both debt and GDP, leaving the ratio of debt to GDP largely unchanged. However, if a bank loan is used to buy an existing asset, like a used car, the purchase will not add to GDP (which measures the production of new goods and services) but will raise the overall debt level within the economy.
It is not surprising that credit growth has accelerated post-crisis. The conditions are ripe for credit growth: low yields and ample liquidity being pumped into the global economy by central banks. The problem with heavily indebted economies is that the financial cycle could peak at any time. At some point, borrowers like households and corporations will conclude that their income is not sufficient to service their debt obligations. This will see the non-financial corporate sector enter into a deleveraging cycle: as has happened previously in Japan, Spain, and the U.S. These are all economies which witnessed a large build-up in debt which was subsequently unwound to a degree with the assistance of central banks, which quickly cut interest rates so heavily indebted households and companies would not go bust.
Whilst the reflation trade has dominated investment markets in recent months, leading to higher bond yields and equity prices, many have taken their eye off the high and rising debt ratios in some of the world’s largest economies. As we are now nine years into the expansionary phase of the global economic growth cycle, and developed economies are still characterised by rock-bottom central bank rates, one has to wonder whether the next global recession will be much longer than the experience of 2008-09.
Join us on Bond Vigilantes TV, where this week we discuss:
We will also discuss about upcoming events for the week in the economic calendar. Tune in!
The world will soon turn to the inauguration of Donald Trump. For at least the next four years, global investment markets will be focusing on his Presidency. This is always the case when a new President takes over the reins of the most economically powerful country in the world, but why does it feel more important this time?
Firstly, political deadlock has been broken. For the first time since 1928, the Republicans have the White House, the House, and the Senate. Therefore government policy is more likely to evolve from gradual, to radical.
Secondly, having a President that has no background in politics is going to result in a different type of leader than has historically existed within the US political system, making for a more unpredictable Presidency than has traditionally been the case.
Both of these points are regularly discussed, and are common themes amongst political analysts. The concept that I discuss below is a potential third dynamic that evolves from these two points.
The nature of leadership is a strange one. In a democracy the leader is a servant appointed by the electorate, whilst at the same time the President when appointed is expected to use his or her executive powers, that have been granted, to govern. The combination of the non-career politician and the electoral clean sweep in the US imply that the electorate have chosen a leader they want to lead and a political system that will facilitate his views. This makes for potentially interesting times.
We do not know the exact policies the Trump administration will pursue, and even if we did we cannot calculate the exact effect of these policies. It appears that a shift to the right in economic and social policies is a given in the short term. One thing is immediately clear, leadership is back.
Societies and markets have gone through a ten year phase of low confidence in economic and political leadership. Why did economists not see the recession coming ? Why did governments allow asset bubbles ? Where is the economic recovery amongst the lower and middle classes? Scepticism towards effective economic leadership from the politicians, and central bankers, is high. The cause and effect of policy decisions (such as quantitative easing) is often seen as confusing at best, and irrelevant to the real world at worst. The connection between decisions and consequences has become muddled. With the election of Donald Trump, this is about to change.
Donald Trump as President will make markets once again focus on the connection between policy decisions and market actions. We already have evidence of how his direct approach can influence economic outcomes, with the correlation between his ascendency and the Mexican Peso’s weakness being the most obvious example. The new President’s style is short and direct, and policy will be set by a man of few words, not many. Causal relationships will once again become very evident between the administration and markets. This will be evidenced in a number of ways, whether it is a wide-ranging economic decision, or a pointed dig at a particular company. In the short and long-term these pronouncements will effect economies and markets. Whether they are good or bad policies, and who they help or hurt we will find out over time. The one thing that will be established in coming months will be to re-establish the psychology of political and economic leadership over markets.
There was a lot of talk about animal spirits at the onset of the financial crisis. Animal spirits were singled out for fostering a boom in credit, and their subsequent collapse resulted in an anaemic recovery. We are now likely to see confidence in the US government to return, not necessarily because their decisions are correct, but because policy actions will produce an identifiable result. Policy scepticism will disappear as the link between policy decisions, and economic/market outcomes once again will come into full focus. This is something that has been absent post the financial crisis.
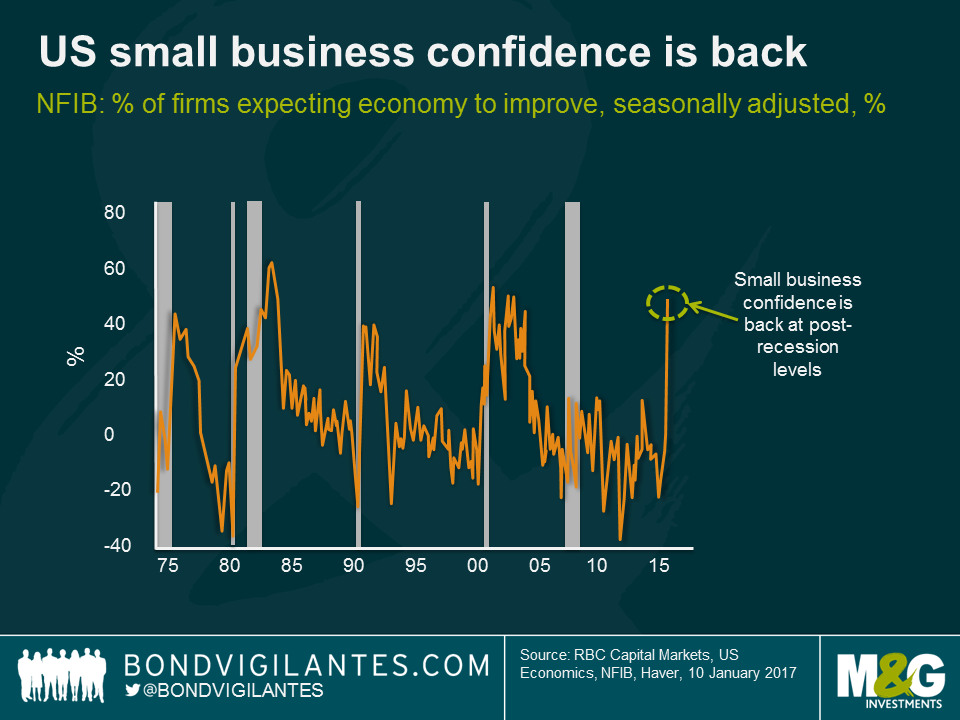
Indeed, a shift in confidence is already underway within the US economy. The chart below shows the jump in small business confidence, a sector that is a strong driver of investment, employment and growth in the USA. This swing in confidence is the biggest shift seen on record. Previous jumps in small business confidence mark the end of previous recessions, and point to periods ahead of economic growth for the US.
This is not the first time a change in leadership expectations has taken place. For example, in Franklin. D. Roosevelt’s inauguration speech he produced his famous quote; “the only thing we have to fear is… fear itself “. The FDR administration went on to embark upon a direct programme of linking government actions to economic outcomes.
Unlike those dark days, the US economy is fortunately currently near full employment. The rediscovery of belief in leadership will permeate through the rest of the new administration, and out into the behaviour of the leaders of companies in the private sector. This should help animal spirits, consumer confidence, and the economy. In asset markets it will mean the requirement for loose monetary policy will diminish, whilst corporate investment in existing businesses and through mergers and acquisitions is likely to increase. Leadership is back, decisions will be made, and let’s hope that they are good ones.
Join us on Bond Vigilantes TV, where this week we discuss:
Tune in for our thoughts on the stories making headlines this week.
Last week, in line with expectations, China announced the renewal of the $50,000 limit of dollar purchases by individuals. What’s changed however is that the foreign exchange commission (SAFE) has tightened the scrutiny on the foreign exchange purchases. Applicants are now required to detail the purpose behind their transactions in order to ensure that the purchase is for “suitable purposes” (e.g. overseas studies, outbound tourism, business abroad, overseas medical treatment, the purchase of non-investment insurance and consulting services), adding a new layer of bureaucracy, in an attempt to reduce the purchases.
I was in Hong Kong on a business trip last year, opining on China’s regime and capital controls with an analyst. During our discussion I touched upon my blog where I put the capital outflows into perspective by calculating the appropriate level of international reserves by looking at a common metric, the Assessing Reserve Adequacy ratio (ARA), which measures reserves versus debt levels, monetary aggregates and trade. This time around, I’m making things simpler by answering a straightforward question:
If 1% of the population decides to buy $50,000, how does this measure up versus a country’s actual international reserves?
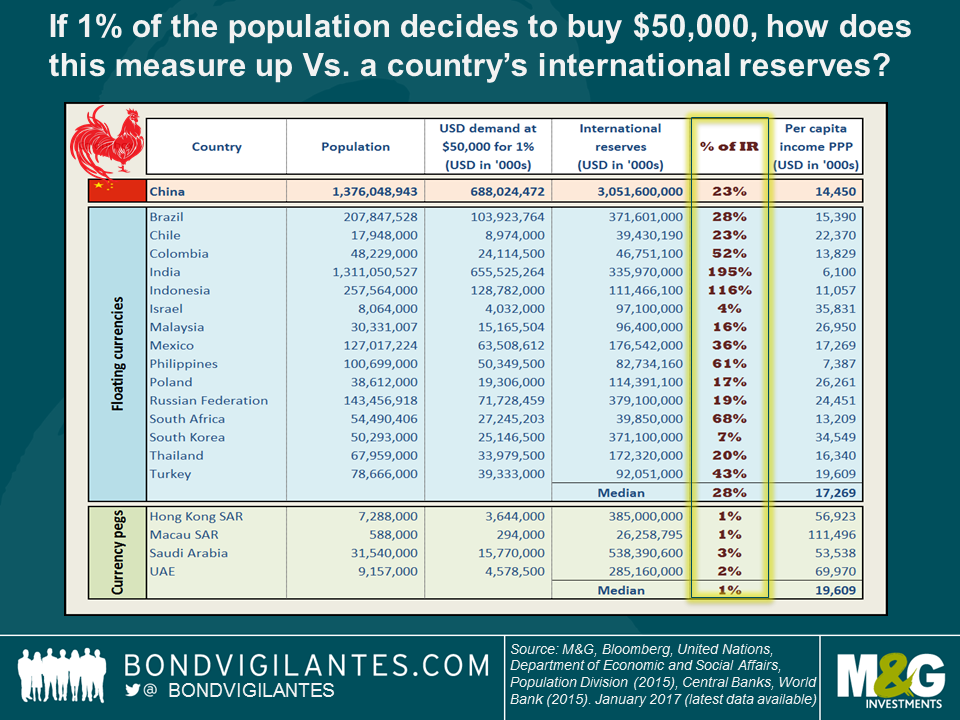
At first glance, China’s potential retail USD demand, at 23% of foreign exchange reserves, is not too far off the 28% median result. However, the countries are not homogeneous. Indeed, most countries with a floating currency regime have an open capital account. It’s also important to note that the exercise includes countries with large current account surpluses, such as Korea and Israel, which have in the past accumulated large amounts of reserves through past interventions to prevent further currency appreciation[i]. Finally, countries such as India have a large population but low per capita income (see final column in the table). Therefore although we do not have details on the per capita income skew beyond Gini coefficients (so it is difficult to estimate how easy it is for 1% of Indian citizens to tap into $50,000 worth of savings), in all likelihood, it will be more difficult to do so than, say, the Indonesians.
Countries with a fixed exchange regime and an open capital account need to have much higher reserve buffers, which is precisely what the table indicates, with this measure coming in much lower at 1-3.
China finds itself somewhere in the middle. It does not have a free floating regime and the capital account restrictions remain significant. Corporate debt levels are very high, so tightening monetary policy aggressively to make Renminbi assets more attractive is not an easy option. With a high level of household savings (there is no household savings data for all countries, so I omitted this relevant fact in my calculations, but China potentially has the highest household savings of the countries listed), the pent-up USD demand will linger as long as there is the perception that inflow and outflow of dollars remain imbalanced. On a cheerier note, the gradual changes to China’s currency regime are moving in the right direction, towards a more flexible arrangement[ii]. But based on the crude metrics above, a free floating currency with full capital mobility is still a long-term prospect.
The Chinese new year is fast approaching and we will soon be celebrating the year of the Rooster, let’s hope that the tighter capital controls calm things down so that the chickens do not come home to roost.
[i] Should Mr Trump decide to label a country as a currency manipulator, the US Treasury should be targeting countries like Korea, not China. Korea remains on the US Treasury monitoring list. See here for more details on the monitoring criteria.
[ii] PBoC just announced a reweighting of its CFETS currency basket index to include 11 additional currencies, namely the KRW and a few other EM currencies, which will help to reduce the CNY broad appreciation should USD strength continue or should, for example, Korea be labelled a currency manipulator by the US Treasury.
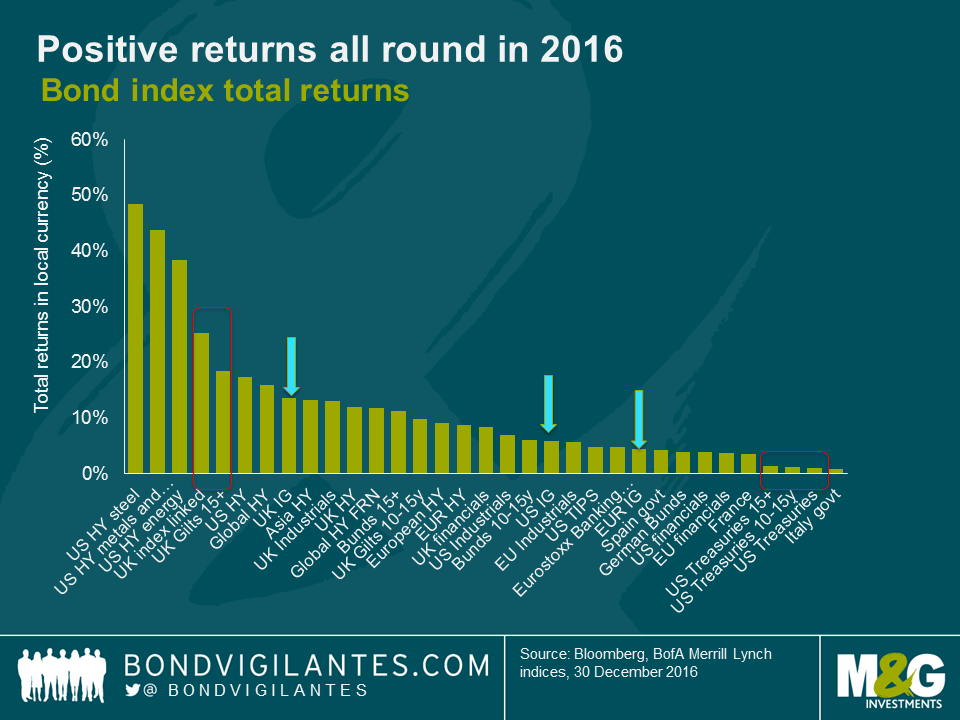
Turning back the clock to the first week of 2016, fears of a Chinese slowdown and the Federal Reserve beginning to normalise rates hit stock markets hard. By Valentine’s Day bond yields had fallen to – what was then – all-time lows. But we hadn’t seen anything yet. Ongoing ECB QE, Brexit, UK QE, novel Japanese monetary policy, president-elect Trump and ECB tapering. In a year of political and economic upheaval, what’s surprising is that developed market government bond yield curves have barely moved. Here’s a wrap up of both bond and currency market performance in 2016, in what was a positive year for bond returns. For a review of the good performance of emerging market bonds please click here for Claudia’s latest blog.

Governments
So what were the best and worst performing asset classes of the year? In the government bond space, it was long term gilts. The EU referendum propelled the UK gilt market to the top of the table as compared to -1.5% in 2015, with index-linked and conventional gilts returning +20% and +10% respectively in 2016. In stark contrast, US TIPS delivered just 4.8%, despite an increasingly tight labour market and increasing inflation expectations. Longer term treasuries delivered muted returns at year end, despite a rollercoaster year (putting this into context; an investor holding a US 10y treasury from January to July would have benefited from a 8% return. However if they continued to hold this until December, the return would have fallen to around 1%).
Investment Grade
Investment grade bonds made a comeback in 2016, with credit spreads compressing over the course of the year, which made a welcome change from 2015 – see Wolfgang’s blog on this here.
Europe led the pack initially, with spreads in the BBB space flirting with pre-crisis levels and delivering a return of 5.5%. Indeed, November marked the first time since March 2013 that European credit was flagging as cheaper than US BBBs on a relative basis. 2016 ended with UK BBBs looking attractive with premiums at 184bps. UK BBBs did deliver 11.4% returns but with arguably longer durations than the US and European counterparts.
High Yield
US high yield was the best performing bond sector of the year. If you recall, oil was just $26 a barrel back in January 2016 and US energy companies were feeling the pain. February was the trough in the oil price however and by November, Brent had recovered to well over $50 a barrel, in part due to the OPEC agreement. This marked the turnaround in oil price and the performance of the ML US HY energy index which delivered -24% in 2015. By the end of the year the index had delivered a not insignificant 38%, ahead of most other asset classes (despite the global oil and gas sector experiencing 51 defaults), while US Steel and US Metals and Mining delivered total returns of 48% and 43% respectively.
Some sectors struggled in comparison, still delivering positive returns, but in single digits. US healthcare suffered given the election result with a total return of 4.1%, whilst banking delivered a muted 4.3% in response to the troubles with ongoing concern surrounding peripheral NPLs. The European banking index did however snap back in the final quarter, more than making up for the losses earlier in the year and delivering returns of 4.8%, as financials responded well to the ECB’s year end tapering signal.
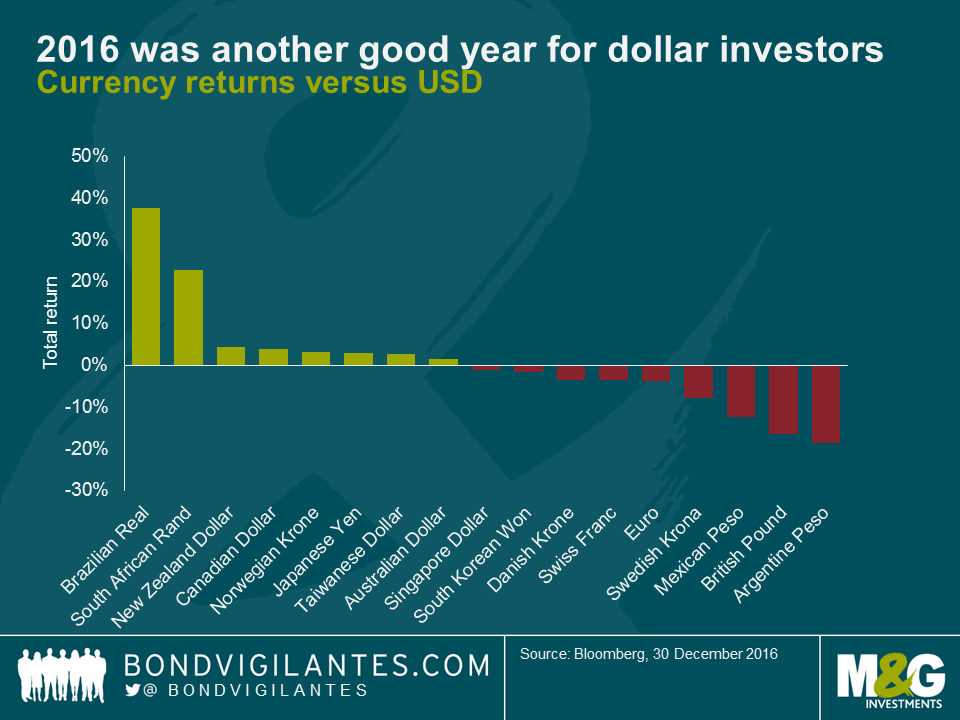
Currencies
Currencies dominated the headlines in 2016, not least in the UK given the referendum result. Sterling immediately fell 10% against the dollar and 16% by year end. The euro also came under pressure versus the dollar, given the increasingly divergent stance of monetary policy. As the chart shows, 2016 was another strong year for the US dollar, with sterling, the Swedish krona, euro and swiss franc all depreciating relative to the greenback. Japanese Yen, viewed often as a safe haven, finished the year holding its own. Although no longer pegged, the SNB’s defence of the Swiss franc against the euro has seen CHF weaken in line with the euro versus the dollar.
Join us on Bond Vigilantes TV, where this week we discuss:
1) 2016 – a quick review
2) recent government bond yield sell-off – was it really that big?
3) Eurozone inflation – back, but for how long?
Tune in for the charts, articles and the Bond Vigilantes team’s thoughts on the stories making the headlines in the bond markets this week.


Sign up to the Bond Vigilantes mailing list to ensure you never miss a great article from our expert Bloggers. We will email all new articles to your inbox, meaning you can stay on top of the world of Bonds.
I confirm that I would like to receive information about Bond Vigilantes and products and services from M&G Securities Limited.
We will use the email address and personal data you have shared with us to send you this information. For existing customers, submitting your contact details and requesting to receive this information from us, will replace any earlier choices you have made in respect of marketing information.
You can unsubscribe from marketing at any time, at which point we will not send any further marketing information to you, by selecting the unsubscribe link in all communications.


