
A wrap up of 2016 bond and currency market performance
Turning back the clock to the first week of 2016, fears of a Chinese slowdown and the Federal Reserve beginning to normalise rates hit stock markets hard. By Valentine’s Day bond yields had fallen to – what was then – all-time lows. But we hadn’t seen anything yet. Ongoing ECB QE, Brexit, UK QE, novel Japanese monetary policy, president-elect Trump and ECB tapering. In a year of political and economic upheaval, what’s surprising is that developed market government bond yield curves have barely moved. Here’s a wrap up of both bond and currency market performance in 2016, in what was a positive year for bond returns. For a review of the good performance of emerging market bonds please click here for Claudia’s latest blog.

Governments
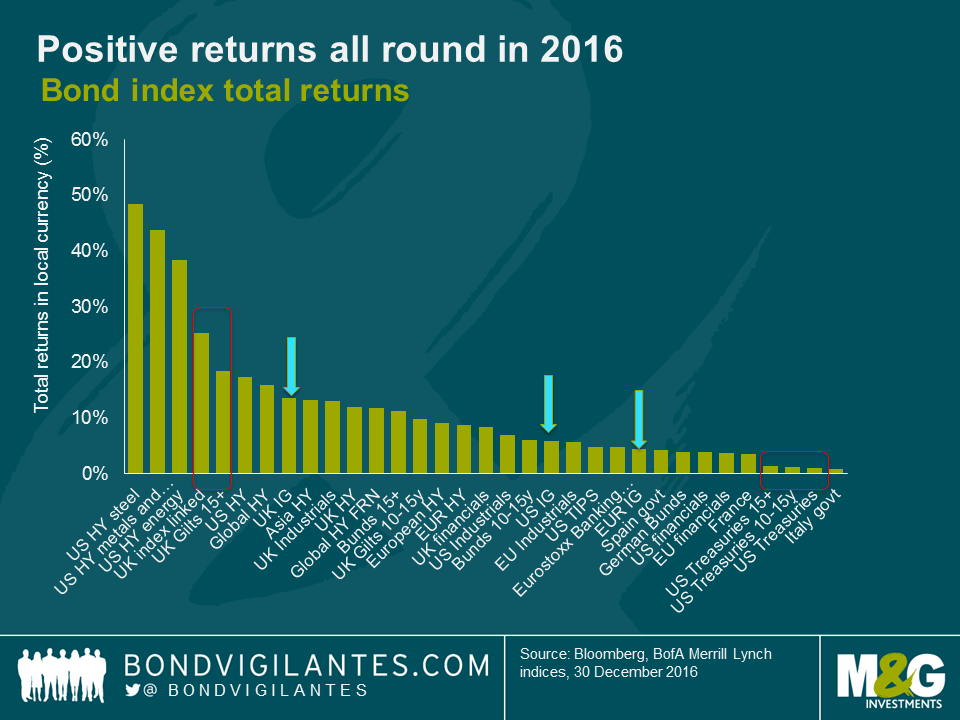
So what were the best and worst performing asset classes of the year? In the government bond space, it was long term gilts. The EU referendum propelled the UK gilt market to the top of the table as compared to -1.5% in 2015, with index-linked and conventional gilts returning +20% and +10% respectively in 2016. In stark contrast, US TIPS delivered just 4.8%, despite an increasingly tight labour market and increasing inflation expectations. Longer term treasuries delivered muted returns at year end, despite a rollercoaster year (putting this into context; an investor holding a US 10y treasury from January to July would have benefited from a 8% return. However if they continued to hold this until December, the return would have fallen to around 1%).
Investment Grade
Investment grade bonds made a comeback in 2016, with credit spreads compressing over the course of the year, which made a welcome change from 2015 – see Wolfgang’s blog on this here.
Europe led the pack initially, with spreads in the BBB space flirting with pre-crisis levels and delivering a return of 5.5%. Indeed, November marked the first time since March 2013 that European credit was flagging as cheaper than US BBBs on a relative basis. 2016 ended with UK BBBs looking attractive with premiums at 184bps. UK BBBs did deliver 11.4% returns but with arguably longer durations than the US and European counterparts.
High Yield
US high yield was the best performing bond sector of the year. If you recall, oil was just $26 a barrel back in January 2016 and US energy companies were feeling the pain. February was the trough in the oil price however and by November, Brent had recovered to well over $50 a barrel, in part due to the OPEC agreement. This marked the turnaround in oil price and the performance of the ML US HY energy index which delivered -24% in 2015. By the end of the year the index had delivered a not insignificant 38%, ahead of most other asset classes (despite the global oil and gas sector experiencing 51 defaults), while US Steel and US Metals and Mining delivered total returns of 48% and 43% respectively.
Some sectors struggled in comparison, still delivering positive returns, but in single digits. US healthcare suffered given the election result with a total return of 4.1%, whilst banking delivered a muted 4.3% in response to the troubles with ongoing concern surrounding peripheral NPLs. The European banking index did however snap back in the final quarter, more than making up for the losses earlier in the year and delivering returns of 4.8%, as financials responded well to the ECB’s year end tapering signal.
Currencies
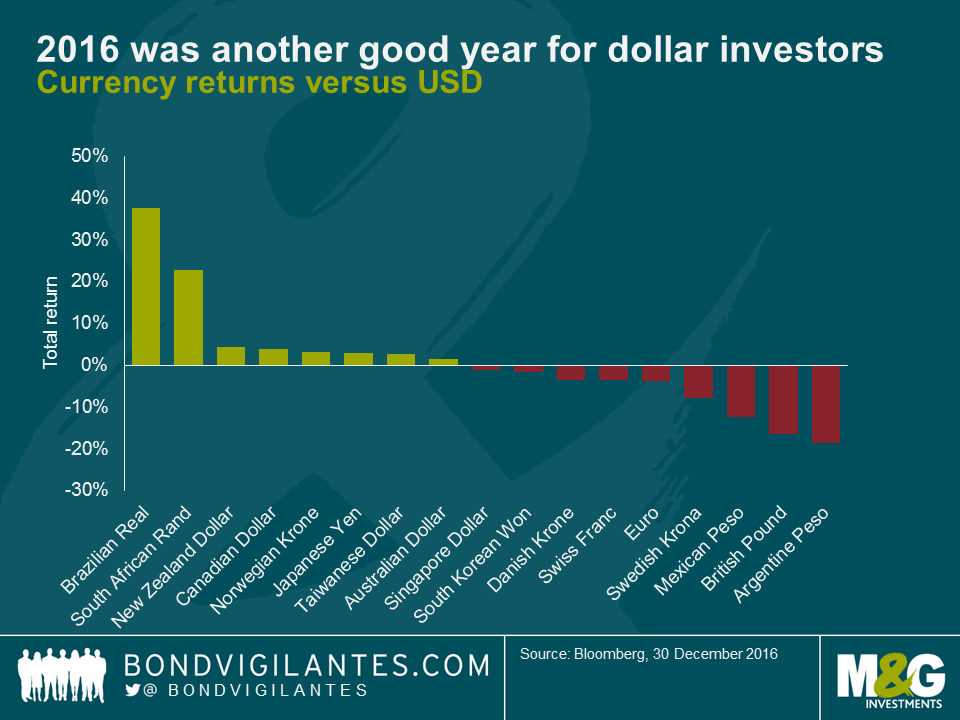
Currencies dominated the headlines in 2016, not least in the UK given the referendum result. Sterling immediately fell 10% against the dollar and 16% by year end. The euro also came under pressure versus the dollar, given the increasingly divergent stance of monetary policy. As the chart shows, 2016 was another strong year for the US dollar, with sterling, the Swedish krona, euro and swiss franc all depreciating relative to the greenback. Japanese Yen, viewed often as a safe haven, finished the year holding its own. Although no longer pegged, the SNB’s defence of the Swiss franc against the euro has seen CHF weaken in line with the euro versus the dollar.
The value of investments will fluctuate, which will cause prices to fall as well as rise and you may not get back the original amount you invested. Past performance is not a guide to future performance.
17 years of comment
Discover historical blogs from our extensive archive with our Blast from the past feature. View the most popular blogs posted this month - 5, 10 or 15 years ago!


Bond Vigilantes
Get Bond Vigilantes updates straight to your inbox