
Rolldown
A dispatch from the number crunchers – Yield curve rolldown
By Matthew Russell
15 April 2026

We’ve talked before about how important political risk will be in 2017, as French markets have been the latest to discover. Tune in to this week’s edition, where Fund Manager Wolfgang Bauer joins me as we discuss:
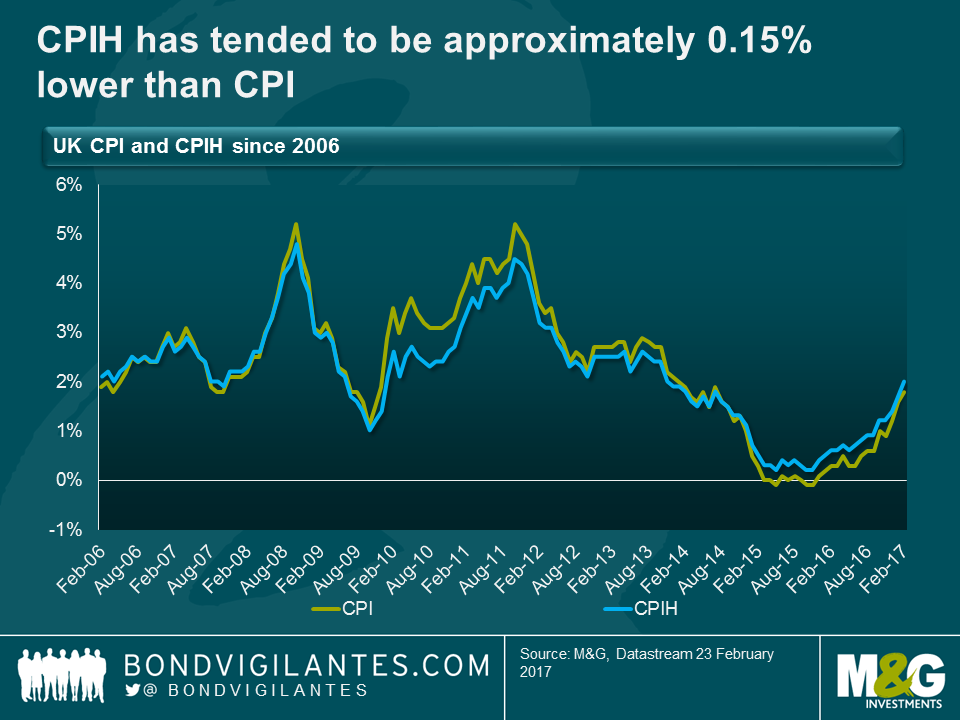
In the UK, as of next month the official measure of consumer prices will become CPIH, with the H standing for housing. As at today, the only difference between CPI and CPIH is the inclusion of owner-occupied housing in the latter, on a rental equivalence basis (“how much would it cost to rent the home I own?”, a similar measure to the Owners’ Equivalent Rent component of US CPI), which has a weight of around 16%. So when rental inflation runs below CPI (as it did in 2009 and 2010), CPIH will tend to be lower than CPI, and vice versa. Recently, given the greater weighting of the residual (i.e. non-rent) items in CPI, falling food and energy items have had a larger downward impact on CPI than on CPIH. Interestingly though, over the longer-term, CPIH has tended to be approximately 0.15% lower than CPI.
The different long – and short – term dynamics of the two indices has some interesting policy ramifications. Given that CPIH is now the preferred measure of consumer price inflation, it may well have future implications for the Bank of England’s price stability mandate (though it won’t automatically become the Bank’s target, the Chancellor could change this), as well as for the indexation of pensions and state benefits, and potentially for CPIH-linked gilt issuance. Remember that in the 2011 consultation on CPI linked gilts, one of the main objections to acceptance of such a programme was the uncertainty about CPI’s suitability given the lack of housing in the index. RPI, the measure on which existing UK index-linked gilts pay interest, does include a measure of housing cost (via a “depreciation” element and mortgage interest payments).
Over the long term, with CPIH expected to be circa 0.15% below CPI, one could argue that the BoE will find UK inflation (CPIH) even further below its desired 2% target (it’s unlikely, but not impossible that the inflation target would be lowered from 2% to 1.85% to reflect the typical wedge between the two measures). This might enable rates to stay lower for longer, or additional QE to be justified. A more hawkish reading might point to the UK’s housing scarcity and current pressures in the rental market as putting persistent upward pressure on CPIH, although perhaps surprisingly given the media coverage of the problems faced by Generation Rent, the official rental inflation number fell at the end of 2016 to equal its lowest reading since the series began in 1997, with year on year growth of just 1%.
We used to have bear and bull markets, now we have a “chameleon market” to keep us on our toes.
In this week’s edition we will be joined by Richard Woolnough, Fund Manager.
Tune in and listen to our latest thoughts:
1. We are at the point of peak oil pass through: January and February 2016 saw oil prices reach their lows ($34.25 Brent January 20th and $26.21 WTI, February 11th), so this week’s inflation numbers will see some high year-on-year oil price base effects, as will February’s. This is one of the main reasons why we have been seeing significant rises in inflation in recent months.
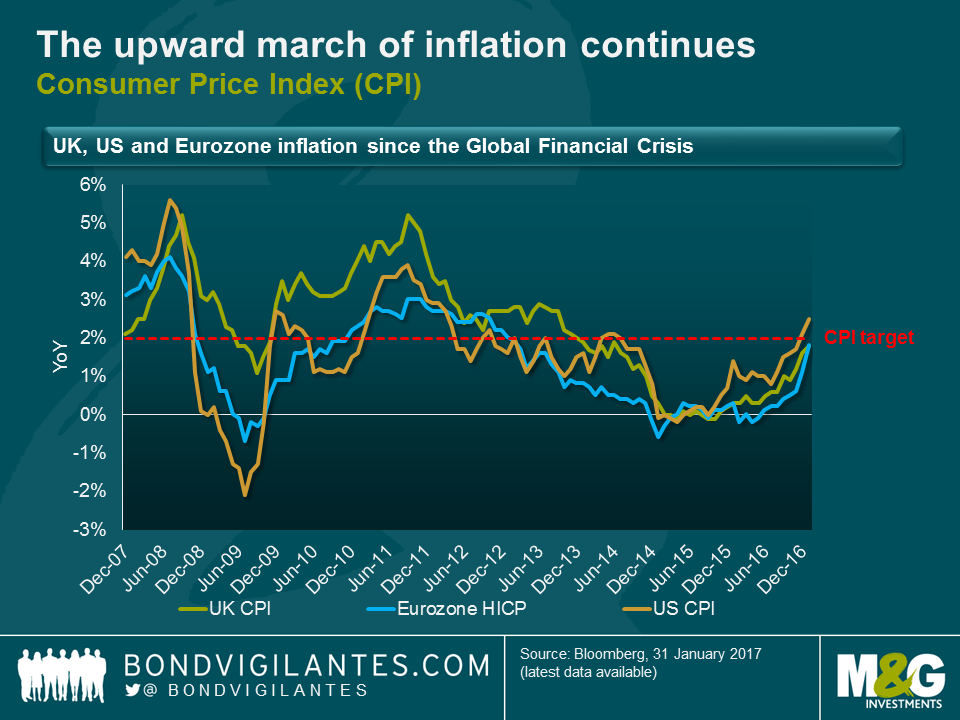
2. The upward march of inflation continues: US CPI was at 0% in September 2015, was less than 1% in July of last year, and is now back at 2.5%. European inflation was negative in May of last year, and this week approached the ECB’s target, at 1.8%. UK CPI was negative in October 2015, was less than 1% in October of last year, and this week reached 1.8%, only very narrowly below the Bank of England’s target.
3. The UK was the only market to disappoint expectations this week, with 1.9% expected in CPI and 2.7% in RPI. However, most of the surprise came from significant falls in clothing and footwear. January sales discounting, which had been falling in recent years, increased meaningfully this year and caught consensus out. The items experiencing positive base effects (fuel, lubricants) and sterling depreciation pass-through (imported goods) were up strongly on the year.
4. UK inflation is actually back on target: well, at least on the National Statistician’s preferred measure of headline inflation it is. As of next month, in fact, CPIH will be the official headline measure of inflation in the UK (don’t worry, gilt linkers still reference RPI!). On this measure, UK inflation hit 2% this week. More on this shortly.
5. Breakeven valuations are no longer exceptionally cheap
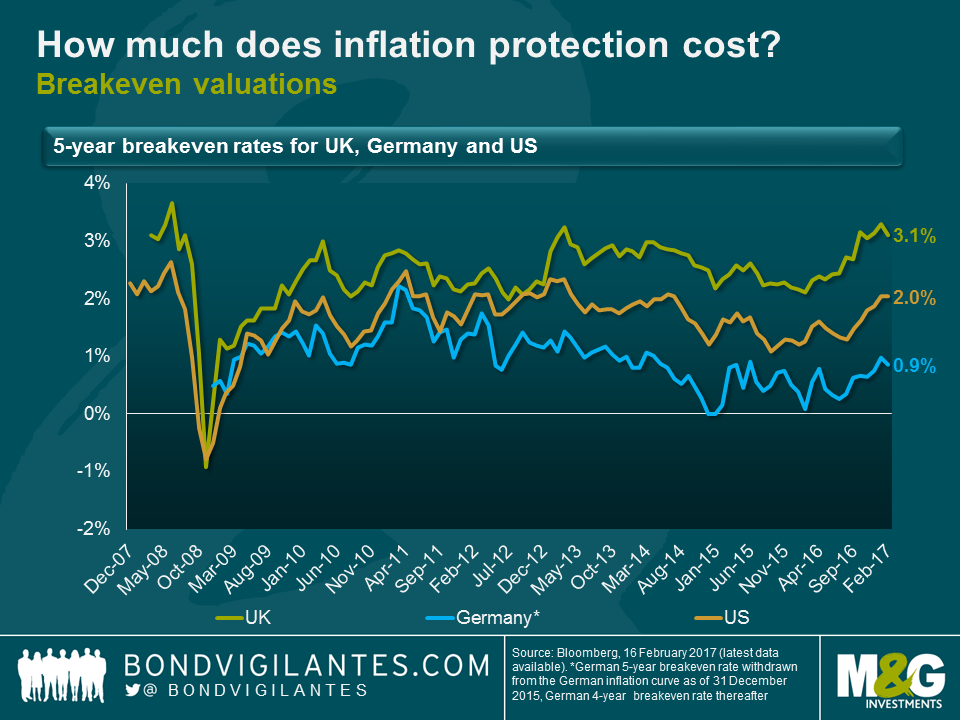
6. US: 2% across the curve for the first time since 2014 tells us the bond market expects the Fed to deliver CPI at 2% on average from this point on. In actual fact, I would argue this is still somewhat cheap, as the Fed targets the PCE deflator at 2%, and over the long term, for the PCE deflator to be at 2%, CPI would be closer to 2.5%. Nonetheless, the last twelve months have seen a big move in US breakevens.
7. UK: with breakevens between 3.1% at the front end and at near 3.6% at the long end, the recovery since the lows of the early parts of 2016 is as remarkable as in the case of the US. In fact, barring some aggressive assumptions about the RPI-CPI wedge, the UK market is priced for UK inflation to be above target, forever. I see value in short-dated breakevens, because oil and sterling weakness are going to see a period of significantly higher inflation than target. But quite what the market is seeing that makes these inflation overshoots look permanent remains to be seen and, to my mind, makes long end breakevens vulnerable.
8. Europe: breakevens have also recovered strongly in Europe as elsewhere, but remain significantly below pricing in the achievement of sustainably on target inflation. Perhaps the concern is that the recent strong HICP numbers will not persist past the oil price base effects? And that seems a reasonable concern to me.
We have come a long way in the last year in the inflation markets. The question from here, though, is whether we are going to see inflation fall back once we are past the peak oil base effects period, in the middle of 2017, or whether momentum and the reflation theme can be maintained. In the US, at least, it appears to me that the labour market and, in particular, wages are going to see momentum continue. As I recently blogged, given the significant differences between US and UK household debt, it looks to me as if the Fed is already well behind the curve, and may find it hard to catch up with it. The prevailing question for me remains whether this rising tide in the US will lift all boats, or whether European inflation and the long end of the UK market will sink back from current levels.
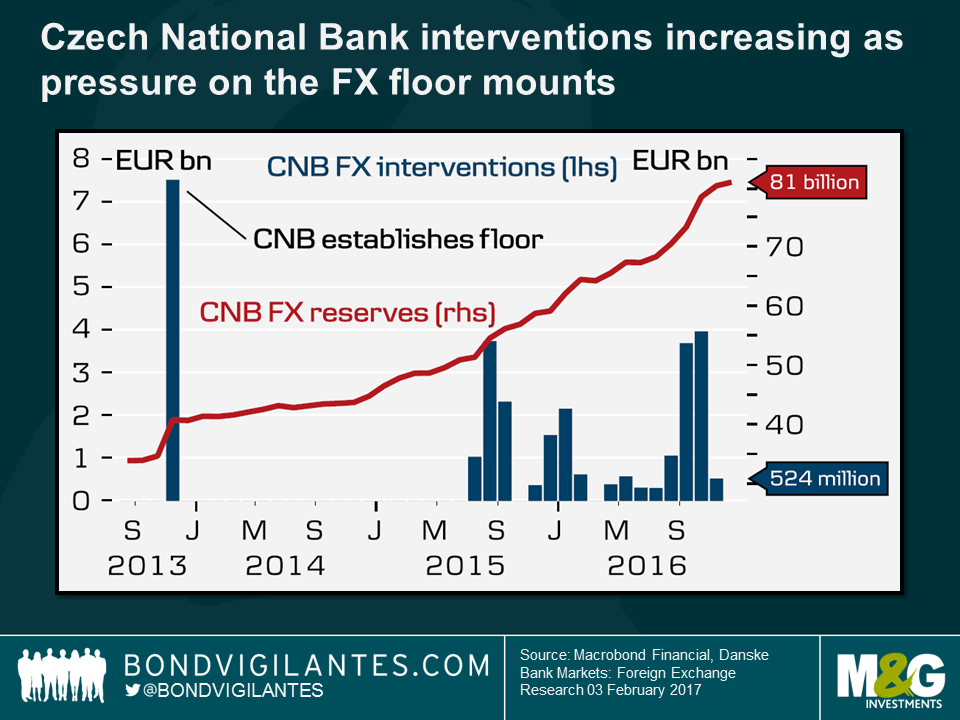
For over 3 years, the Czech National Bank (CNB) has maintained the Czech Koruna (CZK) exchange rate close to 27 CZK to the Euro (EUR), essentially using its currency – as opposed to interest rates – as the policy tool to achieve its inflation target. Earlier this month however, the CNB advised that this strategy would be exited “around the middle of 2017”. Though the timing remains ambiguous (they previously stated that the cap would be exited “in mid-2017”), the message is clear: the removal of the FX floor is looming and how the market responds will be of interest.
The EURCZK cap was first introduced in November 2013 after a short period of CZK appreciation. Since the Czech Republic is an export driven economy which is highly dependent on trade with countries in Europe (particularly Germany), the policy subsequently served as an effective way to weaken the currency, ensuring its competitiveness with its main trading partners whilst easing monetary conditions domestically. It’s regarded as a floor as the target is asymmetric; the CNB will not allow the currency to appreciate markedly from the aforementioned level, obliging them to intervene (i.e. by selling CZK and buying EUR) in the currency markets in order to maintain the strategy. Given this, CNB EUR reserves have more than doubled over the duration of the programme, with the size and frequency of interventions increasing in recent months as currency speculators have entered the market, upping the pressure on this managed floor.
The floor was introduced to ease monetary policy; the removal will be used to tighten it.
With an inflation target of 2% (plus or minus 1%), CPI had been outside of this range since early 2014. The October reading garnered attention however when it fell within the CNB’s tolerance band, which was sustained through November. What was particularly surprising was that the 2% target was reached in December – something that the CNB wasn’t expecting to achieve until Q3 2017. On Friday CPI surprised to the upside once again, this time hitting 2.2%. The rise was largely due to higher food prices as well as base effects kicking in from the unwinding of the year-on-year fall in fuel prices. Encouragingly, core inflation (which excludes oil) also increased, while wages are expected to continue to remain on an upward trajectory. This rise in domestically driven inflation, alongside an expectation of some externally imported inflation (the economic development of the Eurozone is significant, due to the trading links and thus the potential for spillovers from the growth in industrial producer prices) feels as though the previously high hurdle for the removal of the FX floor has been lowered. Cue the currency speculators.
Given the FX floor, the CZK has perhaps been kept artificially low, leading many to surmise that the removal of the floor will lead to significant currency appreciation. Speculators should however be mindful of three key points.
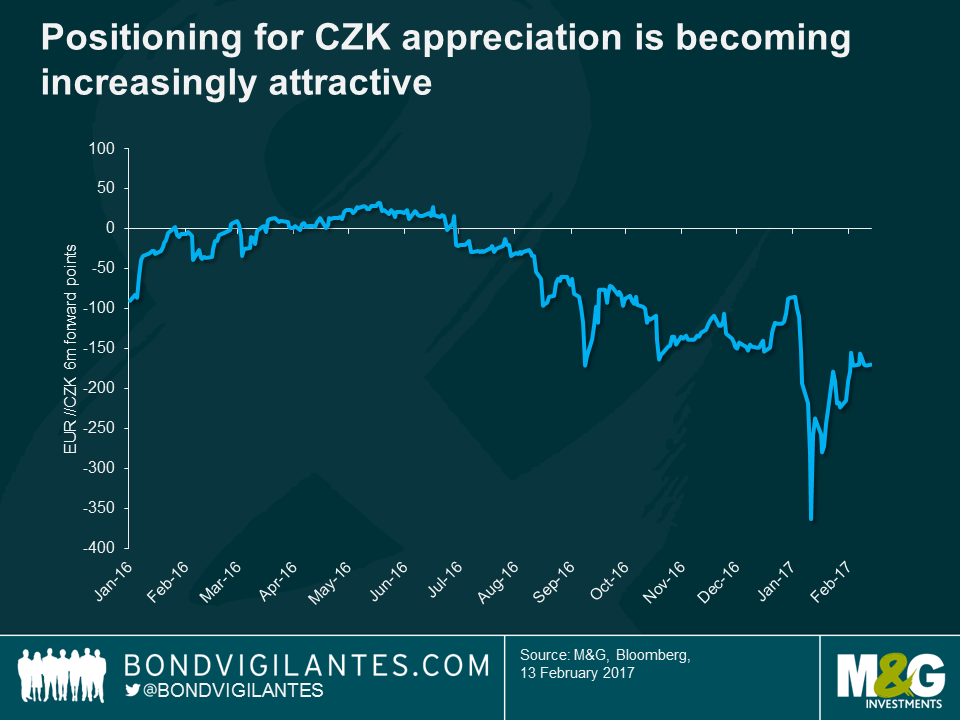
The inflation numbers from Friday exceeded expectation, which may further encourage buying of CZK, as investors anticipate the removal of the FX floor. However, I have struggled to find a forecast which predicts appreciation significantly in excess of the EURCZK 25.7 level discussed; which is perhaps testament to the credibility of the CNB. What will happen when they remove the floor? Time will tell.
The IFS (Institute for Fiscal Studies) Green Budget hit the headlines last week with its forecast that, over the course of this parliament, the UK tax burden is set to rise to its highest level in 30 years. The IFS has calculated that by 2020 the proportion of national income raised through taxes will increase to 37%.
I was at the presentation, and the more concerning issue for me was the rather gloomy picture the IFS painted of UK GDP growth over the next couple of years. The UK economy grew by 2% last year, and the IFS expect growth to slow to 1.6% this year and 1.3% in 2018. Andrew Goodwin of Oxford Economics talked the packed Guildhall through the components of GDP and explained where they see the future weakness.
Consumer spending
The chart below – contributors to GDP growth in 2016 – clearly shows that the lion’s share of growth came from consumer spending last year.

The IFS contend that consumer-driven growth is unlikely to persist as consumers will be subject to a substantial squeeze in their real incomes (driven by flat wages and higher inflation) and will be unable or unwilling to borrow in order to keep spending.
I think there is definitely something to this argument, especially for those of employment age who already have historically high levels of personal debt. However, as the IFS themselves pointed out in a later presentation (on the pressure the NHS is likely to come under), the impact of shifting demographics will be key. I foresee these demographic changes being a major contributor to UK consumption growth in the coming years. I don’t think it’s a coincidence that the savings ratio began its recent decline around the same time that the first cohort of baby boomers reached the retirement age.
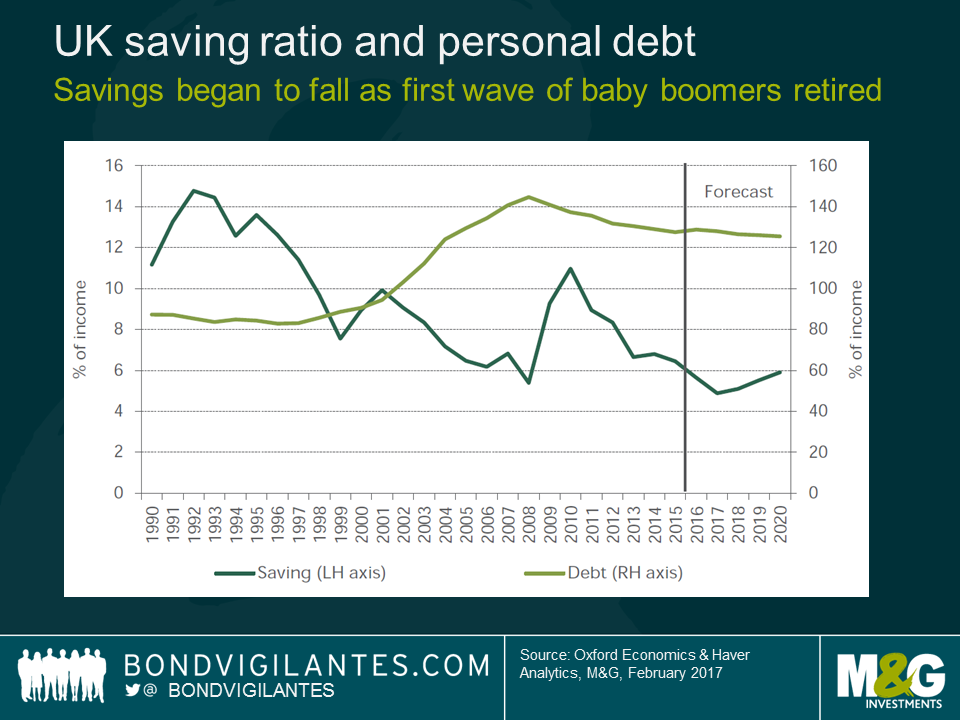
The 2011 census showed that in that year alone the number of people reaching 65 jumped by 30%. This trend of the post WW2 generation ending their working lives (saving for retirement) and beginning to draw their pensions (spending those savings) has a long way to run. It makes a lot of sense to me that the “grey pound” will help consumer spending stay buoyant in UK for some time yet.
I think it’s also worth remembering that 52% of voters believe that life will be better outside the EU. Whether they are proven to be right or not, why would one expect them to cut back on consumption in the short-term? They will likely only reduce consumption when (and if) the economic consequences of Brexit begin to hit home.
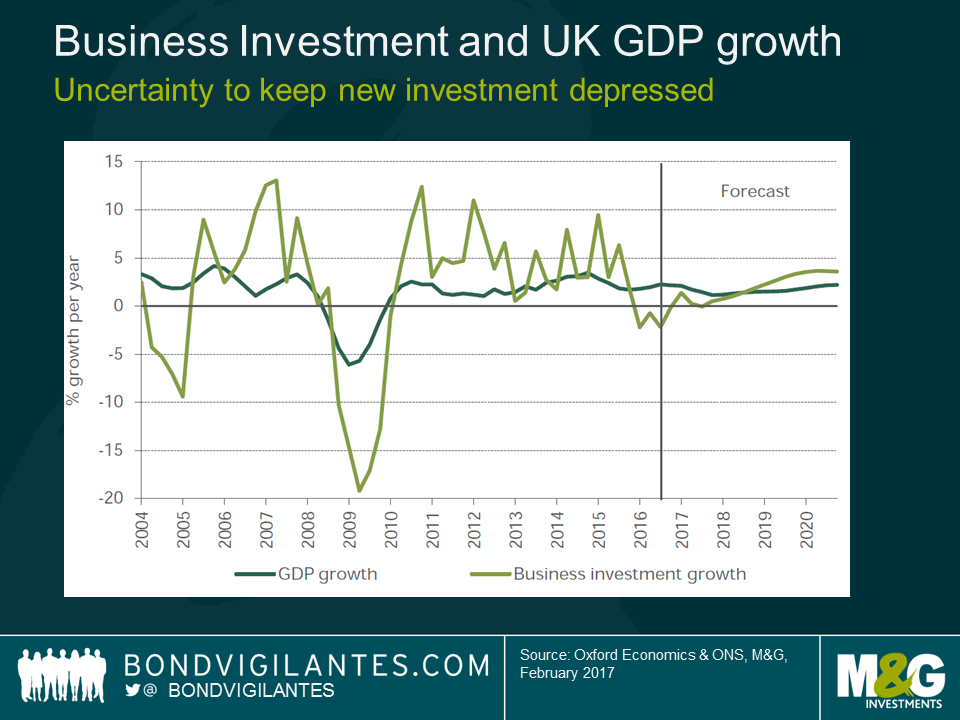
Investment
The IFS expect business investment to remain subdued due to “Brexit risks”. I don’t have any argument with this view. The inherent uncertainty of going through a period in which the UK will renegotiate its global trading arrangements will likely cause a pause in investment, until there is some more clarity.
Government spending
In short, austerity is here to stay. So we can’t expect an increase in government spending to contribute meaningfully to GDP any time soon.
Net trade
The presentation highlighted that, even with a roughly 20% devaluation in the pound, non-oil exports actually fell year on year. The suggestion is that, thus far, UK exporters have kept the prices they charge abroad the same. UK companies have preferred to increase their profit margins rather than attempt to increase market share by cutting prices.
I beg to differ on this forecast. Assuming no further sterling weakness (which I admit isn’t a given), a profit increase driven by a currency translation effect is a one off. Firms wishing to maintain this profit growth overseas will likely begin to reduce prices in an effort to capture a greater market share. If the strategy works we should begin to see UK exporters’ increased competitiveness come through in higher export volumes, rather than just in higher profit margins over the next few years.
A couple of special guests joined me for this week’s Bond Vigilantes TV. Tune in and listen to our latest thoughts on:
It’s rare to find a piece of writing that EVERYONE in bond markets has read and is talking about, but in January, a blog by Paul Schmelzing on the Bank of England’s excellent Bank Underground site did just that. Paul is a visiting scholar from Harvard University, working at the Bank of England to research foreign exchange policy in the era of Bretton Woods. In the blog however he took a very long view of eight hundred years of bull and bear markets in government/risk free bonds. You can read the blog here.
Paul came in to see us earlier this week to discuss three of the significant bond bear markets we’ve seen in the last 60 years or so, and to consider what the next bond bear market might look like once the “Volcker bull market” eventually comes to an end.
The cost of new mortgage borrowing and payments on outstanding household debt can have a large impact on the rate of growth of an economy. For this reason, central bankers are interested in the transmission mechanism of monetary policy. It has been shown that interest rates can have a stronger influence on an economy where there are a high proportion of variable rather than fixed-rate mortgages. Whilst there are well known differences in the mortgage markets of the US and UK in terms of the proportion of fixed versus variable mortgages, some interesting trends have developed post-financial crisis.
The US mortgage market is now more fixed rate in nature than it has been in a number of years, with variable rate loans falling from more than 20% of outstanding mortgages in 2005 to 2008, to less than 10% now. The average maturity of US mortgages is just over 23 years, owing to the dominance of 15 year and 30 year fixed rates mortgage products. The realised duration of US mortgages tends to be much shorter than this, as the loans are fully pre-payable. However, if we start to see higher yields and higher mortgage rates, these mortgages will be much longer dated than they have been in years.
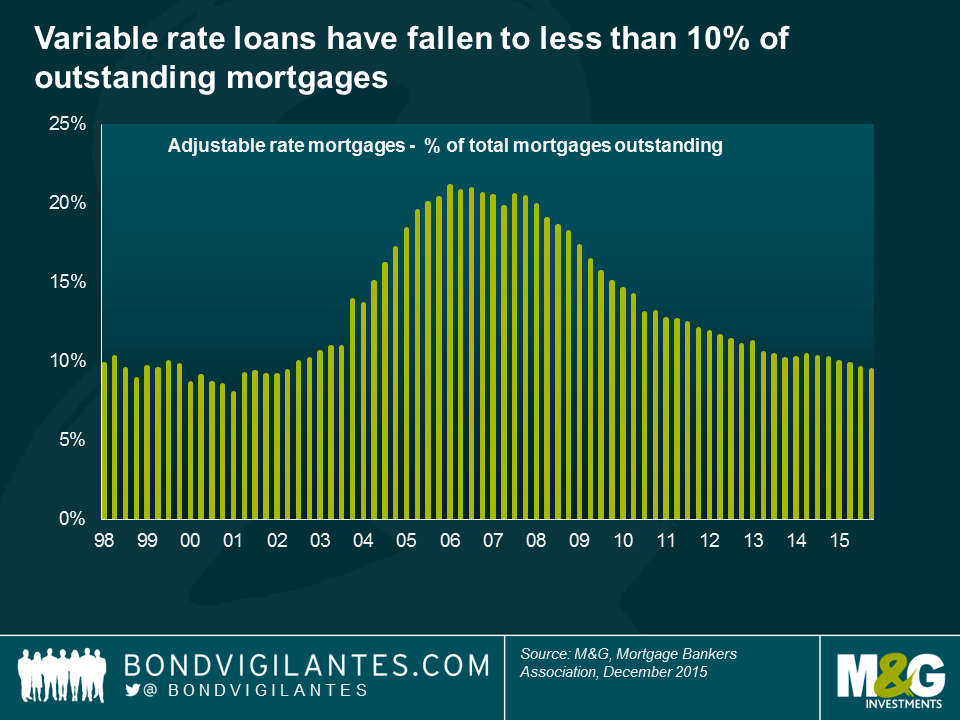
Not only has the proportion of fixed mortgages been increasing, but the average mortgage yield has fallen to 3.8%, a level not seen before in the historic data. In essence this means that the average US mortgage borrower has a 23 year fixed rate mortgage on a rate of only 3.8%.
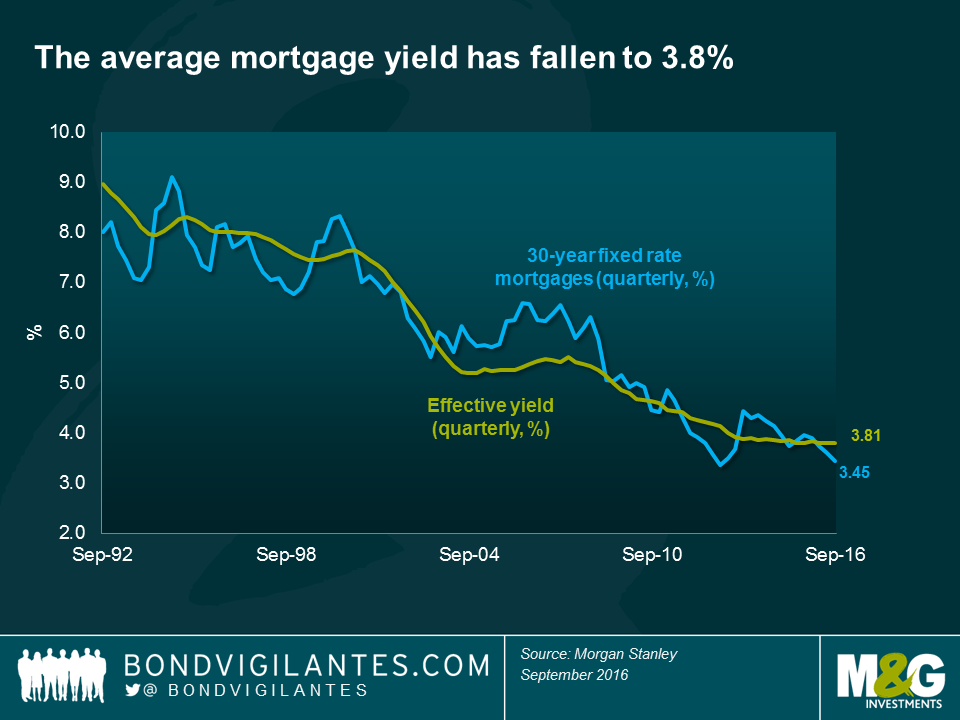
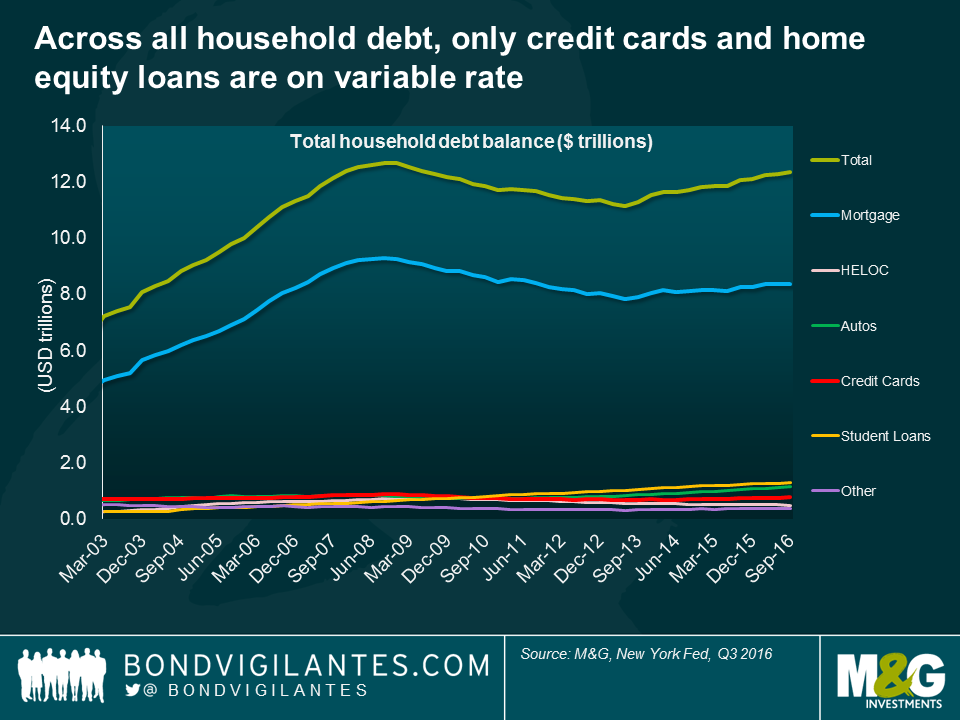
Taking it a step further, across all US household debt, it is only credit cards and perhaps home equity loans that are on variable rates. Thus around 90% of all household debt is on fixed rates. This long dated, fixed, and very low rate mortgage market has implications for the transmission mechanism of monetary policy in the US, meaning that the Fed Funds rate is a blunt tool to slow down the real economy as it takes a longer time for the force of higher interest rates to be felt.
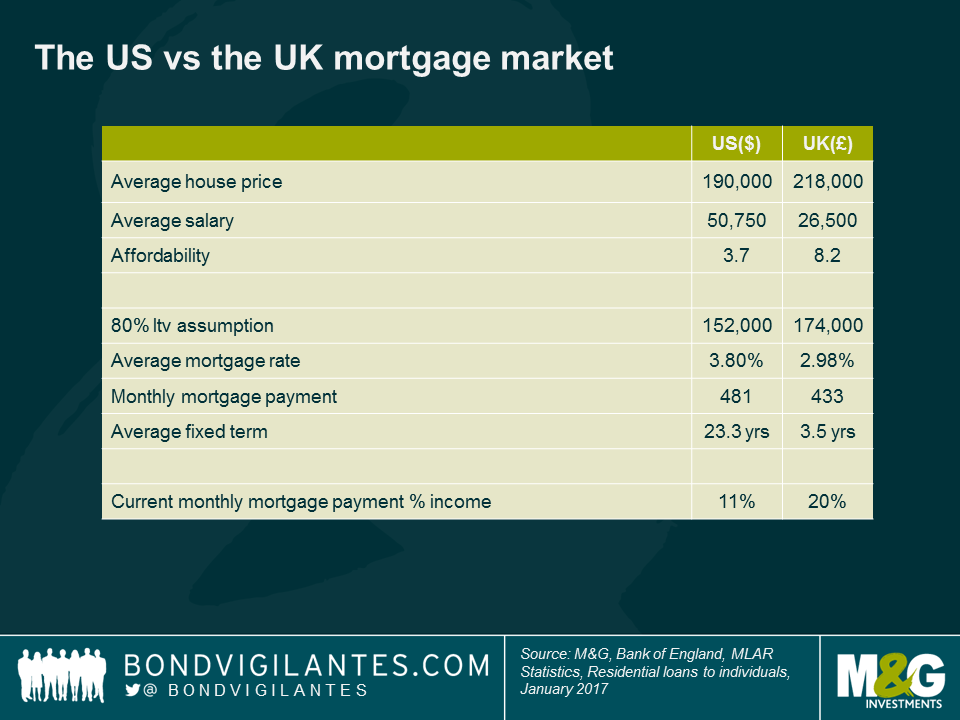
In contrast, in an economy such as the UK that has a fewer proportion of fixed rate loans and much shorter dated fixed rates offered, monetary tightening would be felt much sooner, as the household sector sees more income directed towards servicing loans with less left over for spending. To draw out the contrast between the two mortgage markets, I’ve made some simple assumptions with regards to average house prices, salary etc. At first glance, if we assume 80% loan to value ratios in both markets and take average mortgage rates across both markets, it appears that the two markets require similar monthly payments of $481 versus £433 per month. However, as the simplified affordability measures suggest, this is misleading. As a proportion of the average monthly salary, the US borrower pays just 11% on mortgage payments, compared to 20% in the UK.
Arguably the biggest difference lies in the differing average mortgage terms, 23.3 years in the US versus 3.5 years in the UK market. The impact of this difference, on the monetary policy transmission mechanism, can be further investigated under the assumption of rising rates. To do so, I have assumed constant mortgage margins and a UK mortgage market with 50% variable rate and 50% fixed rates (with fixed mortgages split between 2 year and 5 year terms).
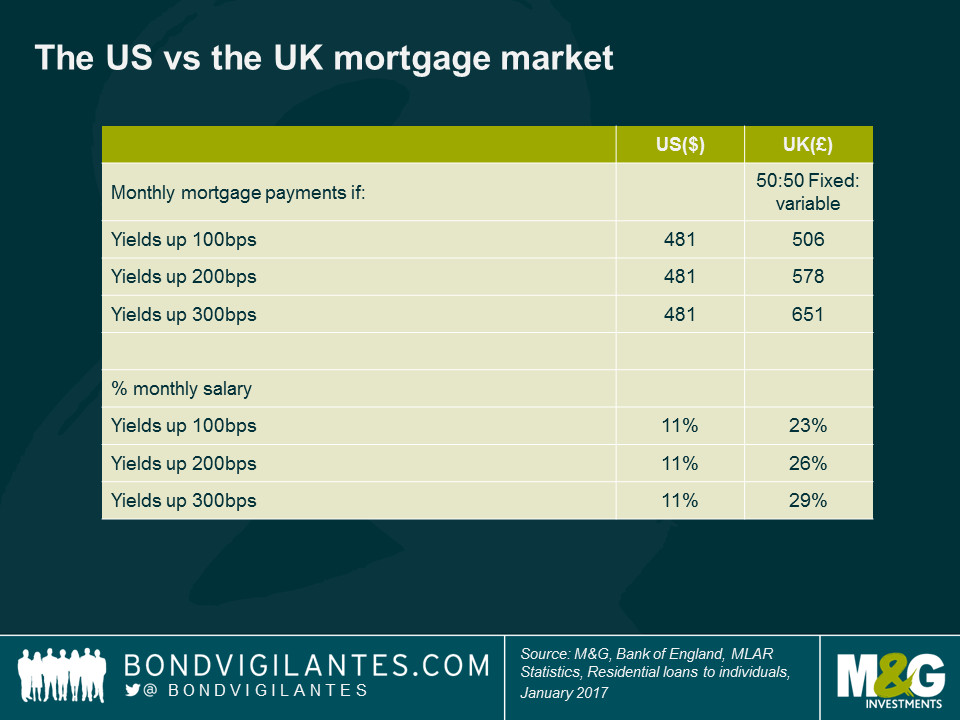
The benefits of fixed rates at low levels in the US are plain to see. For every 1% rise in mortgage rates, the average UK borrower sees 3% more of their monthly salary sucked in to servicing the debt.
In actuality, my assumptions have been generous to the UK market in two key areas. Firstly, I have assumed that the mortgage rate increases occur quickly, so that those on 2year or 5year fixed rate mortgages, stay fixed, rather than reaching the end of the fixed rate and resulting in borrowers having to either re-mortgage to prevailing fixed rates, or take the standard variable rate. And secondly, I have assumed that the variable rate is today the same as the average mortgage rate in the UK (2.98%). A quick search online shows that it is probably more like 4%, or higher.
Though this work has many assumptions and is therefore very subjective, the implications are nevertheless clear; the monetary mechanism and the potential ramifications on consumption differ widely between the two countries. Through UK rate tightening, demand and consumption would adjust relatively quickly. The US household sector at this point in time however is much less sensitive to rate moves, and rates may need to increase higher – or the monetary policy time lag may be considerably longer – than is currently priced in.
Capital markets have experienced a major shift in sentiment over the course of the last couple of months. Fears over secular stagnation and deflation have dissipated, and investors have been willing to embrace risk assets again. Many economists have revised upwards their estimates of global economic growth, starting first with the US where the fiscal reigns are expected to be loosened in order to meet some of President Trump’s pre-election promises to voters.
Whilst there is clear short-term momentum in economies like the US and UK, where unemployment rates are low and consumption is robust, there remain long-term secular themes that investors should be aware of when they formulate long-term investment decisions. One of these themes is a shift in the focus of economic policy, driven by demographics. Unlike economic variables, demographic trends are predictable and greatly impact all of us.
The global economy has now passed an important tipping point. For the first time in recorded history, children under the age of 5 no longer outnumber those aged 65 and above. We have arrived at “peak child”.

The United Nations has estimated that the global population will continue to age, and by 2050 over 15% over the global population will be aged over 65. Economists often point to the challenges that Japan faces as the population ages; by 2050, most of the G7 will have a similar demographic profile as Japan does today, as will China, Brazil and Russia. Longevity risk, the risk that people live longer than expected, could put huge pressure on our current retirement systems. Research from Merrill Lynch Bank of America suggests that age-related spending is already 40% of government spending in developed markets, and as high as 55% for the US. Rising healthcare costs could push 60% of developed market sovereigns sub-investment grade by 2050 without significant policy action.
In order to meet the challenges presented by an ageing society, we will need to work longer and think about policies and initiatives that incentivise people to work past the traditional retirement age. If these issues aren’t addressed, increasing old-age dependency ratios could have wide-ranging impacts on government finances, productivity rates, and inequality. Additionally, we need to have a think about what economic success looks like.

Aging populations represent a huge success for science, with medical advances extending the lifespan of the average human by decades. They also represent a huge challenge for policymakers, and our economic model needs to adapt to this shifting demographic. As Richard has pointed out previously, Gross Domestic Product (GDP) is used by policymakers and economists as a yardstick to compare the relative success of economic policy across the globe. However, using GDP as a measure of economic success is misleading. Focusing on Japan (as an economy that has experienced a high public debt/GDP ratio, private sector and household deleveraging, deflationary pressure and an aging population) we see that GDP suggests that the country is an economic laggard compared to the rest of the G7.
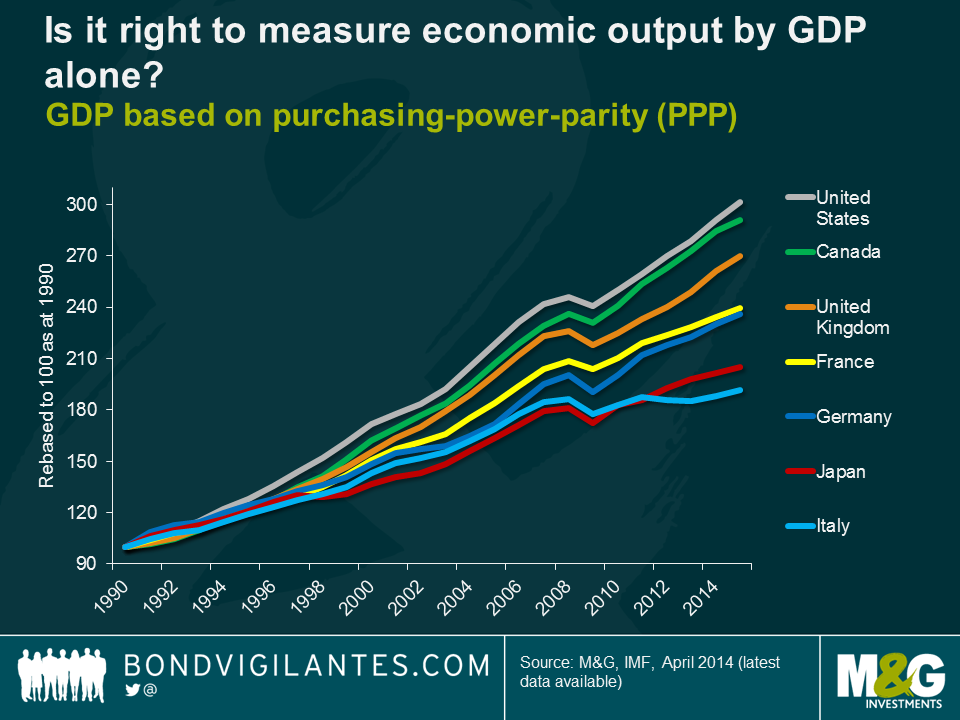
However, looking at GDP per the population of working age (15-64) shows that Japan has enjoyed the third best economic performance in the G7 since 1990. Consequently, Japan has enjoyed a much stronger economic performance than many perceive. Rather than experiencing “lost decades” of growth, the Japanese economy has experienced stable prices, low unemployment and low interest rates. For the average Japanese citizen, living standards have not deteriorated, and on the contrary have improved.

In a world where immigration policy reform is increasingly dominating political agendas, policymakers should recognise that GDP largely reflects a demographic profile where more workers enter the workforce, who (if everything goes to plan) will then produce, earn, and consume more than the previous quarter. Naturally, as the workforce shrinks due to ageing, the reverse will be true. However, it does not necessarily mean that an economy is underperforming if the trend rate of growth is falling to reflect a smaller workforce. The changing demographic trend that the developed and parts of the emerging world are now experiencing will increasingly act as a headwind to global GDP. China in particular, which has driven global growth post-crisis, will likely slow markedly in coming years from historic growth rates. In the future, it will be important for policymakers to look beyond GDP as a measure of economic success, in favour of alternative measures which look at economic well-being.
Whilst it is easy to focus on near-term tactical shifts in markets, it is increasingly important to focus on long-term secular trends that are re-shaping the economies that we live in. Higher rates of GDP are not necessarily the answer to face the challenge of an aging population. Individuals, companies, and governments will have to adapt to these challenges, and we may find that in the future we see a greater focus on intergenerational fairness and living standards than has historically been the case.
Of course, the effects of ageing will have far-reaching impacts on financial markets. Ageing societies will usher in an era of saving, which should provide a tailwind for companies that help people plan, invest and save for retirement.
Fixed income and dividend-paying equities will probably benefit in this environment given both asset classes provide a regular income for retirees to use.
Additionally, the structural demand for longer-dated bonds from insurers and pension funds may limit the extent to which bond yields can rise in the future.


Sign up to the Bond Vigilantes mailing list to ensure you never miss a great article from our expert Bloggers. We will email all new articles to your inbox, meaning you can stay on top of the world of Bonds.
I confirm that I would like to receive information about Bond Vigilantes and products and services from M&G Securities Limited.
We will use the email address and personal data you have shared with us to send you this information. For existing customers, submitting your contact details and requesting to receive this information from us, will replace any earlier choices you have made in respect of marketing information.
You can unsubscribe from marketing at any time, at which point we will not send any further marketing information to you, by selecting the unsubscribe link in all communications.


