
Rolldown
A dispatch from the number crunchers – Yield curve rolldown
By Matthew Russell
15 April 2026

When investing in companies of a lower credit quality, loss given default risk is the key threat that investors have to assess. Consequently, covenant protection is a crucial consideration before lending capital to a company. We wrote about covenant protection back in 2014 and it’s fair to say that covenant quality in the high yield market hasn’t improved much since then; actually quite the opposite is the case.
A report recently published by Moody’s confirms that the bond issuers and advisors are on a strong footing when issuing debt, with demand remaining strong for higher-yielding assets. The North American Covenant Quality Indicator, using a three month rolling average, shows the second weakest protection quality for each credit rating category since 2011, with only August 2015 showing weaker values.
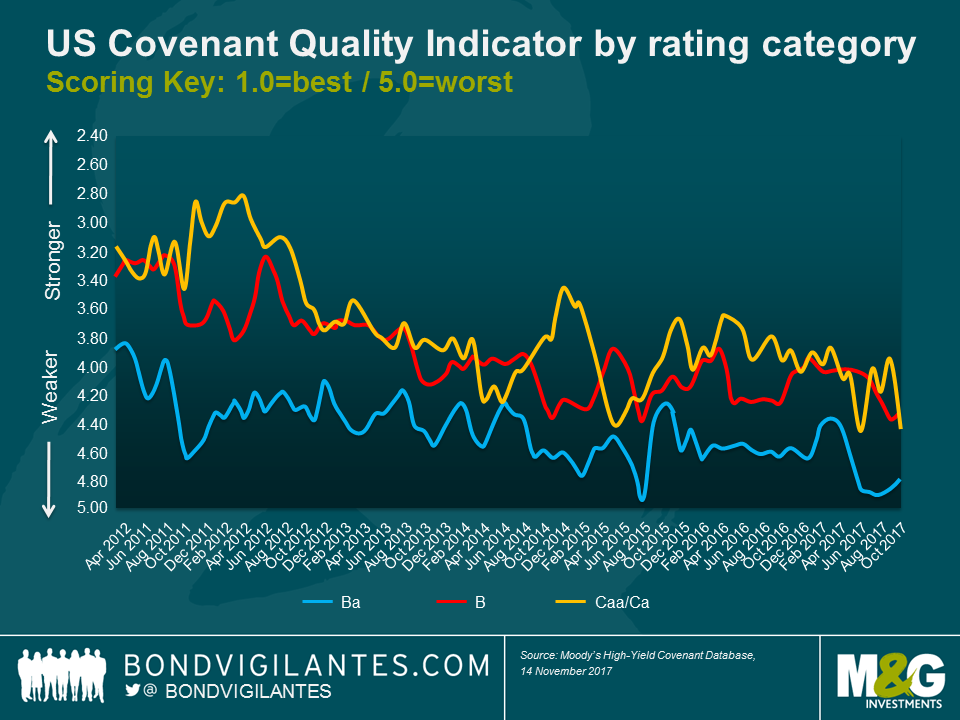
Due to scale and lower leverage levels, bondholders generally require less protection for bonds of a higher credit quality. However, for more leveraged companies issuing debt where credit protection should be at the forefront of investors’ mind, bondholder rights continue to deteriorate. In October, two out of the five new “HY-lite” bond deals (bonds that lack fundamental investor protection) came from B-rated bond deals. Granting this amount of flexibility to weaker credit issuers can have a material impact on recovery prospects.
One would think that this might be a direct consequence of the US market being further advanced in the credit cycle, with investors starting to show signs of complacency. Unfortunately, the European high yield market shows a similar trend.
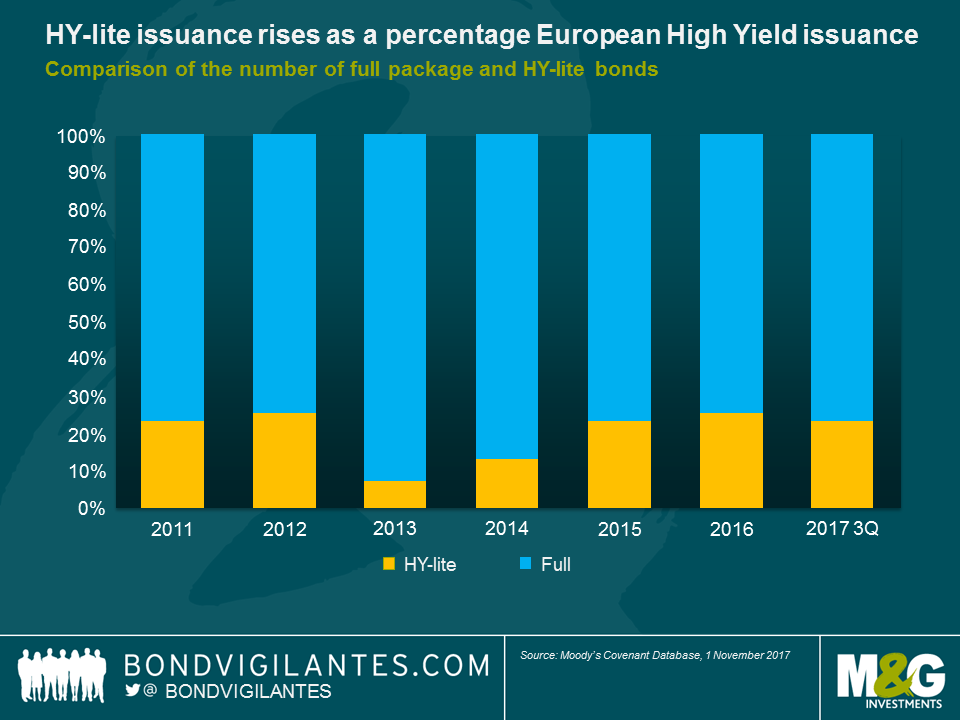
Since 2013, the proportion of so called “HY-lite” bonds has meaningfully increased according to Moody’s. As a percentage of all issuance per year, HY-lite issuance has been rising since 2013, from a level well below 10% to a third of all bonds that come to the market. In absolute terms, investors have actually seen more European high yield bonds with substantially looser covenant terms coming to the market in the first three quarters of 2017 than during the whole of 2015 and 2016.
There is also a significant difference that can be observed between refinancing and new money bonds. Compared to 2013-2014 levels, the size of debt carve-outs is unchanged for refinancings. However, new money bonds show clear signs of covenant erosion where cash leakage baskets have grown from an average of 12% in 2013-2014, to 17% in Q3 2017. Likewise debt carve-out baskets have significantly grown for new money bonds from 16% in 2013-2014 to 25% in Q3 2017.
So is it time to reduce high yield allocations? Not necessarily. Companies still enjoy a favourable macroeconomic environment in a world of global synchronised growth and benign financial conditions. With the US Fed normalising rates gradually from historically low levels and the ECB still in no hurry to hike rates at all, companies can continue to benefit from cheap refinancing conditions for the foreseeable future. Default rates are set to remain low through 2018. Investors, on the other hand, are still able to take advantage of a relatively attractive income stream compared to other bond markets, but credit selection will be vital given a possible increase in idiosyncratic risk factors. Credit spreads, especially in European high yield, do not leave much room for disappointment and the lack of income opportunities in other fixed income markets has increased investors’ willingness to forego stronger covenant protections. In an environment of continued low interest rates in Europe this trend is likely to continue and needs to be watched closely.
A number of asset classes, including listed infrastructure assets, have benefited from the global search for yield that has taken place following a collapse in short and long-term government bond yields. But what if the positive tailwinds of low interest rates and inflation start to reverse? Whilst the current consensus is that monetary policy stimulus will be removed at a very gradual pace, it is important to acknowledge that a sharp rise in inflation may see a policy response in the form of much higher interest rates. Listed infrastructure companies are generally viewed as being highly sensitive to interest rate rises given they generally carry more debt than other companies.
To discuss the impact of higher interest rates, this week on BVTV I’m joined by Fund Manager Alex Araujo for a quick-fire round of questions on listed infrastructure assets.
I made what is turning into an annual pilgrimage to the brilliant Kilkenomics festival in Kilkenny, Ireland, last weekend, this time along with Eric Lonergan and Tristan Hanson from M&G’s multi-asset fund management team.
En route, we met some clients in Dublin and then took the opportunity to set the world to rights over a pint or two in legendary pub Kehoes. In these three short videos, we share our thoughts on, amongst other things, why economies are still struggling to generate inflation, whether interest rates can finally start to rise, inequality and the rise of nationalism, global debt levels and implications of all of these for markets.
(1) Central banks out of control? Political and economic confusion
(2) Do we have a global debt problem?
(3) Memories of ‘08 and implications for equities
Richard Sherry, fund manager in M&G’s institutional fixed income team responsible for impact investing, joined me for this week’s edition of BVTV to talk through an area of the market that has been rapidly gaining attention. Richard unpicks the terminology to explain the differences between the various approaches and offers his view of how the market will likely develop – and what this will mean for bond investors.
Also this week: what can we take from the recent high yield sell-off, and what to watch for in the UK’s budget announcement on Wednesday.
Guest contributor – Tristan Hanson (Fund Manager, M&G Multi-Asset Team)
The following blog was first posted on M&G’s Multi-Asset Team Blog, www.episodeblog.com. M&G’s Equities Team also regularly post their views at www.equitiesforum.com.
The flattening of the US yield curve has inspired much commentary and hand-wringing in certain quarters lately. The concern is overdone.
Looking back at periods of rising US policy rates over the past 30 years, history would suggest there is nothing remarkable about today’s level of long-dated bond yields relative to those of shorter maturities. The chart below shows the gap between the yield on ten-year and two-year US Treasuries:

Longer-dated government bonds have, more often than not, tended to offer higher yields than short-dated bonds, which means the yield curve typically slopes upwards. That is, until the market senses that interest rate policy is ‘tight’ and starts to forecast reductions in the central bank’s policy rate, at which point the curve inverts; an inverted curve being a popular signal of recession around the corner.
In recent months, the slope of the US yield curve has flattened. The reason this has caused confusion is that it has occurred at a time when US economic growth has been robust: the US has just registered 6 months of 3% annualised GDP growth. And so, with the yield curve still positive but at its flattest for 10 years, there are suggestions that the bond market is signalling cause for concern.
Historical perspective
Looking back over 30 years, however, recent yield curve behaviour appears entirely ‘normal’. During periods when the Fed Funds rate is rising, the yield curve flattens so long as inflation expectations and duration risk premia remain under control, which has largely been the case over the comparison period (and very much remains so today).
This time around, we observe the same behaviour: since early 2014, when the bond market gradually began to anticipate the first interest rate hike (as shown by the implied one year rate in one year’s time in the chart below), the curve has flattened appreciably as the Fed increased rates from 0.25% to 1.25%.
Taking the difference between 2yr and 10yr bond yields, the slope of the curve currently is 70bps. Nearly two years and 100bps into a tightening cycle, this looks unremarkable. It is roughly where the slope was in early 2005 and mid-1988, although flatter than in 1994 when the Fed implemented a rapid hiking cycle of +300bps over 12 months. Today’s curve is slightly steeper than the level which persisted through the second half of the 1990s, a period when US real GDP growth averaged an exceptional 4.2%.
It is, therefore, far from obvious that the current slope of the US yield curve represents something to be worried about from a macroeconomic perspective. Strong growth, low inflation and a modestly positive yield curve slope is not abnormal. If the Fed continues on its path of gradual increases in the Fed Funds rate, it would be logical to anticipate a further flattening of the curve, although even this tells us little about how far longer term yields will rise in tandem (if they do so at all).
Rather than its slope, the anomaly compared to recent decades is the low level of US yields across all maturities, a feature of the post-GFC environment, and especially since late 2011. Looking ahead, much depends on whether the Federal Reserve – and the bond market – believe the post-crisis regime of low real interest rates persists, or whether a return to an environment which begins to resemble the ‘old normal’ lies ahead…or, indeed, something entirely different again.
I did it! On 12th November I rode up the 100th and final hill of my challenge, Cheddar Gorge in Somerset.
The UK asset management industry has now raised nearly £2 million over the course of this year through CASCAID. All this money will be going directly to Cancer Research UK. The target was £1 million, so a huge thanks to all those who have donated to the huge variety of different events and challenges that have taken part so far in 2017. We’re still a few quid short of £2 million though, so if you haven’t got round to sponsoring me yet, there’s still time to donate…
Here’s the link.
http://uk.virginmoneygiving.com/fundraiser-web/fundraiser/showFundraiserPage.action?userUrl=JimLeaviss&faId=772830&isTeam=false
The challenge.
I set myself the target of riding up 100 hills, mountains, or kops over the course of the year, roughly two per week. Most of the hills came from Simon Warren’s excellent series of guide books, starting with “100 Greatest Cycling Climbs”. I also allowed myself to cycle up steep things that aren’t covered in any of his guides if they met the criteria of being very steep and horrible; this let me ride climbs like Sa Calobra in Mallorca, and Tabayesco in Lanzarote too.
I rode my first hill of the year on New Year’s Day – Swain’s Lane in Highgate, London. It was raining, setting the pattern for virtually all of my UK climbing days (it was generally nice in Kent, but that was a rare treat for me). I moved on to the Chilterns, then a work trip to Hong Kong gave me a chance to ride up The Peak. Next were the Surrey Alps, some lumps and bumps in Oxfordshire, before heading out east to the short, sharp ascents of the Downs in Kent. My favourite day on the bike of the year was in Flanders, Belgium where I ticked off a number of cobbled climbs like the Paterberg and Oude Kwaremont (I also got to see Paris-Roubaix live the next day). Then up to the Midlands before a trip to Mallorca with my oldest friends. I did not achieve a PB on Sa Calobra. Boo.
West Sussex, Hampshire and “un jour sans” on the Isle of Wight where I bonked into headwinds, got lost, and made the ferry home only by throwing myself under a closing barrier. The Lake District threw up the hardest hill of my year – Honister Pass, which directly after Newlands Hause, had me seeing stars by the top. The hardest hill was followed by the funniest – a client meeting in Bristol gave me a chance to ride up Vale Street, the steepest residential road in the UK. On a hire bike and in suit and leather soled shoes which kept slipping off the pedals, it took me many attempts to get to the top.

Rides in Gloucestershire were followed by a day in the Manchester Peaks. None of us managed to even get 5 metres up The Corkscrew on another rainy day, but we did tick off five great hills that day, including the Cat & Fiddle. Kent again with a chain-gang that was a stretch to hang on to, before more trips to the south coast, including the nasty Ditchling Beacon which will be familiar for anyone who’s ever done the London-Brighton bike ride. A family holiday to Lanzarote let me ride up Tabayesco, the Ironman hill climb in the incredible volcanic landscape.
And finally this last weekend I did a couple of Bath hills, and ended up riding up Cheddar Gorge. Not the steepest of the year’s efforts, but long, beautiful, and for somebody with a 1989 vintage Geography A Level, somehow very familiar. I got a cheque from the Royal Geographical Society for £25 that year, such was the beauty of my exam paper – I’m not sure I have ever mentioned this to my friends and colleagues. You can see all of my climbs on Strava (follow Jim Leaviss).

Thank you.
Firstly thanks to all of you for the superb sponsorship support I’ve had over the year, and for encouragement from friends, family, and colleagues here at M&G. Thanks to Helen and all at CASCAID for running a fantastic effort, and nearly doubling the amount we all raised for Cancer Research UK. Finally thanks to Isobel and the kids for putting up with me disappearing off on the bike at weekends – it’s much appreciated.
See you on top of a hill.
Jim
The list of hills.
Guest contributor – David Covey (Financial Institutions Analyst, M&G Fixed Income Team)
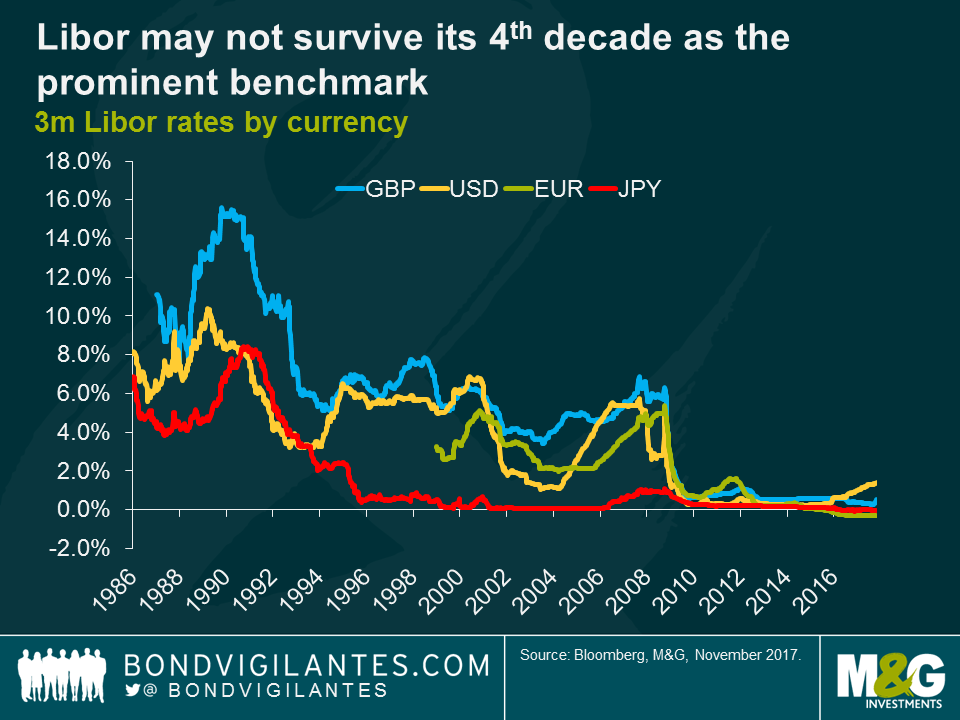
The end is coming for the London interbank offered rate (Libor). Ten years after suspicions emerged that this key interest rate was being manipulated in the financial crisis, regulators are ramping up their efforts to replace the benchmark rates. The Bank of England (BoE) and US Federal Reserve are leading the charge, proposing new benchmarks and setting a target of January 2022 for them to be in place, but they are not alone. Japan and Switzerland are also in the process of replacing Libor, and the European Central Bank (ECB) recently announced it would create a competitor to the Euro interbank offered rate (Euribor) by 2020.
The implications of Libor’s death are massive. They are also uncertain, dependent on not just how Libor rates are replaced, but also what replaces them.
It’s more than just fears of manipulation that are driving reform, though they are certainly part of the motivation. Regulators’ desires for greater transparency and credibility, in the form of transaction-based rates and central bank administration respectively, are also factors. Another is the simple problem that the lending which Libor rates are supposed to reflect – unsecured interbank lending – has declined sharply since the crisis. In the US market, there is little or no actual trading in more than half of the standard Libor maturities according to the Fed. It’s clearly not ideal to ask banks to provide Libor submissions when there are no transactions upon which they can base their quotes.
There’s hardly an investment market that doesn’t have some exposure to Libor. Swaps and other derivatives are clearly the largest, with over $400 trillion in notional outstanding as of year-end 2016. European asset-backed securities (ABS) are almost all Libor-based, as is a good portion of the US ABS market. Though most corporate debt is fixed-rate, leveraged loans are typically Libor floaters, and many corporate hybrids and bank/insurer capital instruments have Libor or swap-based resets. Any change to this key interest rate might be felt on Main Street as well as Wall Street, since a portion of residential mortgages and small and medium enterprise loans are Libor-linked too. Though some of these exposures may mature before 2022, a substantial portion of them will still be outstanding as of the planned transition date.
Uncertainty exists over both what the new benchmarks will be and how the market will transition to them. There’s been progress on the former, as a committee convened by the BoE recommended the “Sterling Overnight Interest Average” (SONIA) as the benchmark rate, while the US has suggested a “Broad Treasury Financing Rate” (BTFR), a rate based on overnight repo transactions. But there’s still some confusion over how these overnight rates will be extrapolated to create a full curve. Furthermore, the fact one benchmark rate is secured (e.g. BTFR) and another unsecured (e.g. SONIA) may create comparability issues. In my view, however, these pale in comparison to transition concerns. Even if there was unanimous agreement on the new rates, how can trillions of dollars of Libor-based contracts be converted to new benchmarks? And what happens to any contracts that aren’t changed?
There are a number of potential solutions, and none are ideal. An International Swaps and Derivatives Association (ISDA) protocol is being developed, but these derivative protocols are voluntary, and would not automatically apply to bonds or other cash instruments. A legislative solution is plausible, forcing contracts to switch over to new reference rates, but lawmakers seem less than keen on this idea and there are uncertainties over the treatment of cross-border contracts.
A cheeky approach would be to change the definition of Libor on reference screens like Bloomberg and Reuters, but this isn’t particularly clean, and as is the case for the other solutions above, the key question of how to set appropriate spreads between the new rates and current Libor remains unclear. For example, a spread would be warranted where the credit risk inherent in a replacement rate differs from that in Libor. This would be particularly important when the former is secured, since Libor is unsecured and should therefore be higher. Requiring banks to continue quoting Libor indefinitely would make this question moot, but we suspect banks’ willingness to do so is limited due to concerns around legal liability.
Investors should be concerned. Assuming an ISDA protocol is followed for swaps, issuers and investors may be left to change bond and loan documents one by one, requiring a colossal amount of administrative work and in some cases, 100% investor consent. It would likely leave at least some “orphaned” investments unchanged, destroying value. The typical “fall-back” reference rate noted in bond documentation, in the event that Libor quotes are unavailable, is a previous Libor fixing. Indeed, it’s not uncommon for corporates to have no fall-back language in bond documents when Libor quotes are not available. This could have the effect of permanently fixing the rate at the last Libor setting, hurting investors in upward-sloping yield curve environments. Issuers which repeatedly access capital markets have incentives to treat investors fairly (i.e. not revert to this default measure), but others, such as “one-off” corporate issuers or ABS transactions sponsored by firms long gone (e.g. Lehman Brothers) may not.
Investors can start now to protect themselves. One way is to voice their concerns to regulators directly or via industry associations. Another is to demand that new transactions have appropriate fall-back language, protecting them from potential worst-case outcomes. Steering clear of exposures which may be at greatest risk of reverting to value-destructive fall-back rates may prove sensible, especially as the market has not yet priced in the risk. In the end, I suspect the vast majority of exposures will transition over smoothly to new rates at some point, but investors should be aware that the loss of Libor may create a real risk of loss in some fixed income investments.
Saudi Arabia, Yemen, Lebanon. The political risk spotlight has swung largely away from North Korea in recent days – despite President Trump’s visit to the region – and towards the Middle East. Fears of a wider regional confrontation have grown after an anti-corruption drive by Saudi Arabia’s young heir apparent, the firing of a missile from Yemen at Riyadh that the Saudis have blamed on Iran and the resignation of Lebanon’s prime minister, saying he was in fear of his life.
Meanwhile, the price of oil is nudging upwards, while bond and CDS markets have been pricing in additional risk quite aggressively. How does this combination of events impact the outlook for the emerging markets and what should investors be looking out for? Watch this week’s edition, where I share our thinking!
Investing in public securities, whether equity or debt, is driven by two primary desires; firstly a need to save for the future, and secondly the requirement to see these savings grow. This results in a need for investors to pursue low risk and high growth investments. In order to understand these risks, assets get categorised based on their potential and historic risk characteristics. Broadly speaking, assets such as bonds are generally seen as defensive, while equities are viewed as more speculative. In order to break the understanding of investment characteristics down further, subsets of investments are produced, and therefore indices have logically evolved to show the performance of these subsets. Indices have now become a significant way for investors to gain investment exposure to asset classes via index funds. This all works well if the publicly available investment universe is well defined. But is it?
When constructing an index, the providers look to construct these using easily understandable and transparent rules. One rule is to ensure that the index reflects the publicly available free float of investment securities. This rule is in place so that distortions do not occur. For example, if there was a large stake in a company that was not free to trade, but the company’s weighting was based on all stock outstanding, then it would overstate the amount of publicly available investment securities.
This is the case for the current plans of the Saudi Aramco listing. The index providers will reduce the weight in the index to the actual free float level, which is a small percentage of the total equity outstanding to avoid distortions. Stating this plainly: if you do not adjust the free float, the index will not represent the truly available securities. Index tracker funds would then drive the price of the limited free float securities (i.e. the actual amount available to buy) higher as they try to get up to the “weight” shown at the index level.
Why does this matter? The monetary response to the financial crisis has been both conventional (via interest rates) and unconventional (via quantitative easing). The latter involves the purchasing of government debt by central banks, in order to print money, drive the term profile of interest rates lower, and increase confidence. This is designed to remove government debt from the public arena, and by definition reduces the free float of available securities. These holdings are not cancelled, but they are not available to be invested in (they are held on central bank balance sheets). Even index providers recognise this could be a potential problem.
What would the world bond indices look like if they treated bonds purchased via quantitative easing programmes in the – what I believe to be, appropriate – manner described? As a market which is currently being distorted by central bank QE, the Euro government bond market is a sensible place to assess this. Looking at the ICE Bank of America Merrill Lynch Euro government bond index, the constituents are capitalisation weighted, based on the amount outstanding. With ongoing QE however, this no longer equates to the actual amount that’s available to buy. So making a point in time adjustment for ECB holdings of government debt and reweighting the index accordingly, the composition of the index changes.
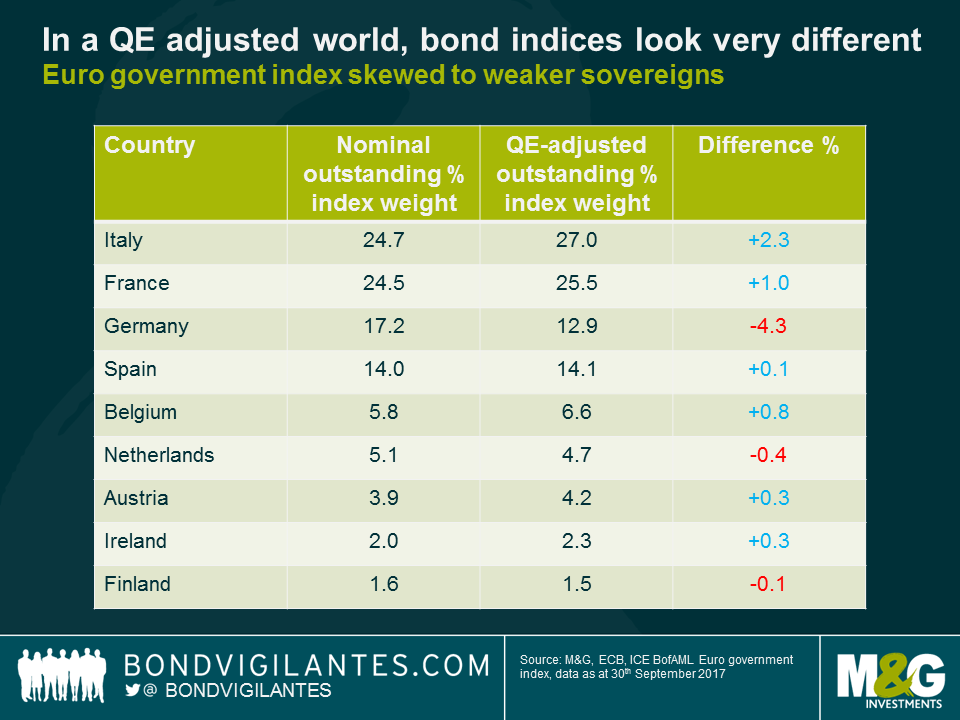
In a QE adjusted world, bond indices look very different, with the Euro government bond index in particular skewed towards weaker sovereigns. Indeed, what’s immediately apparent is the increase in the weight of lower rated sovereigns such as Italy, at the expense of AAA rated Germany. German government debt moves from being the third largest holding (17.2%) to the fourth largest (12.9%) in the newly adjusted index. Since the ECB implements QE by buying government debt in line with the capital key (calculated according to the size of the member state in terms of population and GDP) German government debt represents over 20% of all cumulative QE holdings, reducing the index free-float quite significantly.
QE bond buying has important implications for funds which are tracking an index. If the index weights don’t reflect reality, then tracker and exchange traded funds are chasing increasingly scarce securities, driving up prices, in an attempt to recreate a false investment universe. Index tracking funds and ETFs may be distorting the price of securities that are over-represented in the indices but under-represented in the real investable universe.
There are two main investment implications from this analysis. Firstly, should the index providers alter the way they construct indices to reflect central banks asset purchases? Secondly, has QE resulted in excessive performance of lower debt outstanding (higher quality) sovereign issuers in the Eurozone, and elsewhere? QE is designed to drive bond yields lower, though the construction of indices in their current form and funds that are benchmarked against these indices has contributed to exaggerating this process. This may be yet another unintended consequence of central banks entering into the marketplace for debt securities. In the extreme, will the eventual suspension and reversal of QE result in weaker rated sovereign bonds outperforming their higher rated peers as the distortion is removed?
There was no shortage of topics up for consideration for today’s BVTV: Jerome Powell’s nomination as next Fed chair, further clarity around President Trump’s much touted US tax reform plans, and the UK’s first interest rate rise for 10 years.
With Powell’s nomination very much perceived as preserving the US monetary policy status quo, it’s the latter two developments that I have focused on this morning. Which companies will prove the biggest beneficiaries of Trump’s tax reforms, and what impact will the Bank of England hike actually have on the UK’s real economy? Watch this week’s episode for our latest thinking.


Sign up to the Bond Vigilantes mailing list to ensure you never miss a great article from our expert Bloggers. We will email all new articles to your inbox, meaning you can stay on top of the world of Bonds.
I confirm that I would like to receive information about Bond Vigilantes and products and services from M&G Securities Limited.
We will use the email address and personal data you have shared with us to send you this information. For existing customers, submitting your contact details and requesting to receive this information from us, will replace any earlier choices you have made in respect of marketing information.
You can unsubscribe from marketing at any time, at which point we will not send any further marketing information to you, by selecting the unsubscribe link in all communications.


