
Rolldown
A dispatch from the number crunchers – Yield curve rolldown
By Matthew Russell
15 April 2026

Having eventually emerged from the shadow of its lost decades, Japan is currently enjoying its second-longest economic expansion since World War II, having grown for seven successive quarters. John Lothian, deputy fund manager on M&G’s Japanese equity portfolios, joined me this morning to discuss the outlook for the BoJ and what the positive macro-outlook means for Japanese asset prices.
This year’s Davos World Economic Forum (WEF) comes at a time where equity and credit valuations look high, where we have “obvious” bubbles in cryptocurrencies, and where bond yields – perhaps an anchor for all financial asset valuations – finally seem to be moving higher. Global borrowing across governments, financial institutions, companies and households is at record levels. Can the global economy cope with higher interest rates? In this short video I talk to our CEO, Anne Richards, who has been talking on a panel at the Davos WEF on this very subject. Are we going to see another financial crisis?
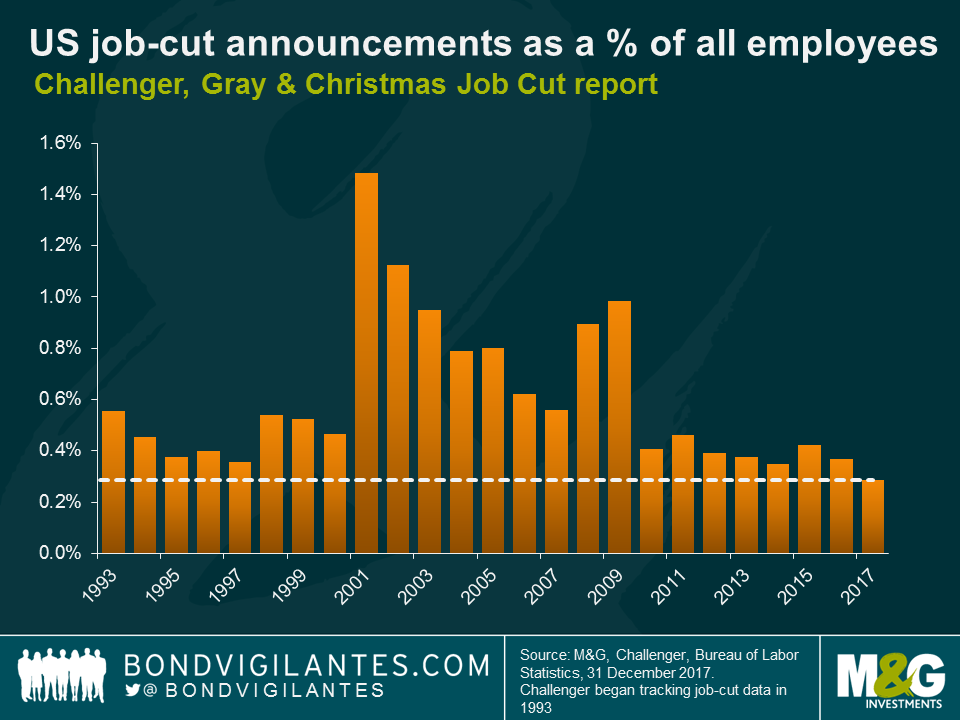
My view is that the US economy is nearer to overheating than slipping into recession. The strength of the US economy is typified by the labour market in many ways. To put some of this strength in context, look at the Challenger, Gray & Christmas Job Cut report. Last year (2017) produced an exceptionally low number of layoffs in nominal terms, and when adjusted to reflect the size of the labour market in real terms, US employers laid off the least amount of workers in the history of the 25 year survey. Due to the strength of the US economy, labour is a wanted good and firms are holding on to their existing workforces.
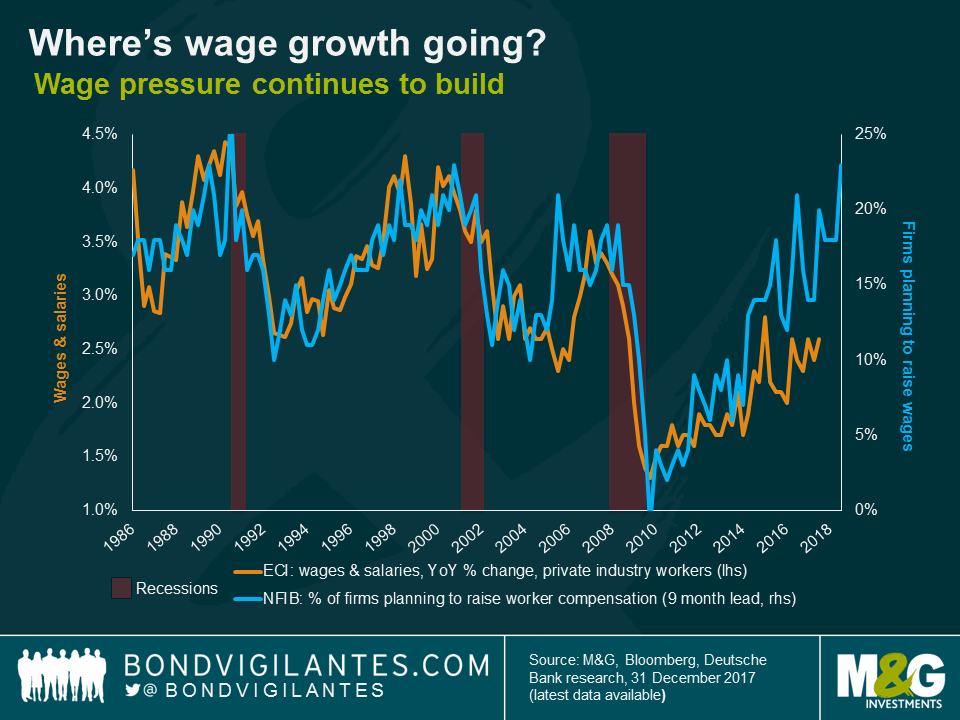
Labour market data is a lagging indicator, so it is important to determine what the outlook for US workers is in 2018. One of the ways to analyse this is to look at leading indicators of likely hiring. One chart I use regularly is shown below. This shows the strong correlation between business confidence and future earnings growth. It looks like a good year for wage growth ahead.
US interest rates have been normalising for a while, and the flatness of the yield curve suggests that markets believe that rates will peak soon. From a technical point of view, as pointed out by Gross and Gundlach, we are at a crucial inflection point. Is the long term structural bull market as shown in the 10 year yield chart below about to resume, or is it over?
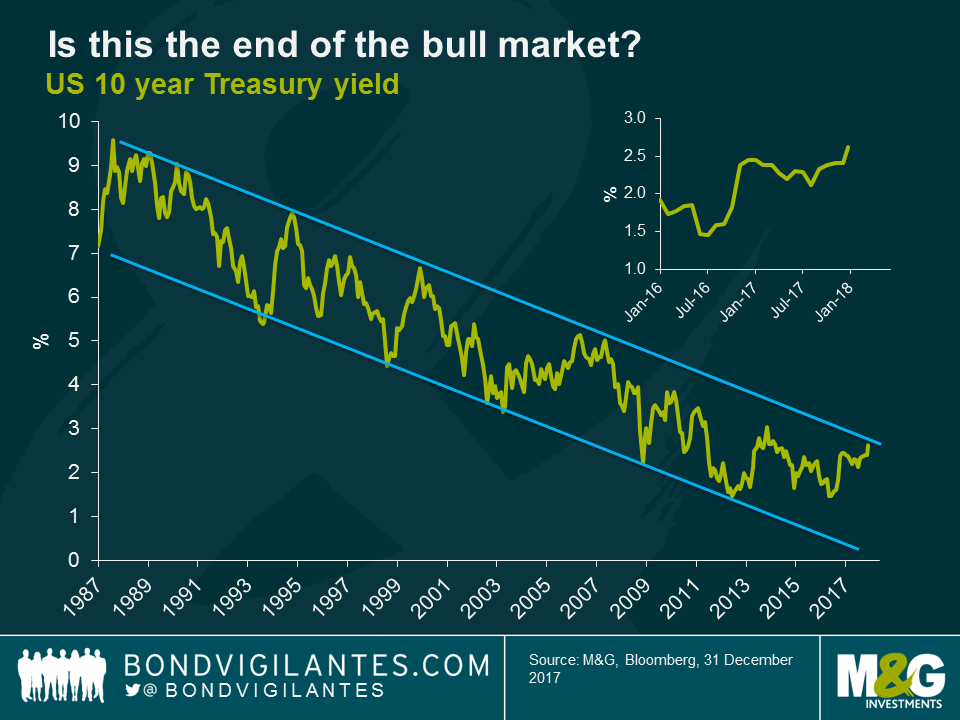
Due to US leading indicator data, the added impetus of tax cuts, strong synchronised global growth, and the return of the missing link of US confidence as I outlined last year, I think the probability of the recent bear market in bonds stopping at this point is limited and it is why I remain short duration across my portfolios.
Venezuela’s cash flow crisis has been well covered. The recent default on its sovereign debt and likely default on the debt issued by its state-owned company, Petroleos de Venezuela SA (PDVSA), combined with collapsing imports attest to its ongoing cash crunch and humanitarian crisis. ¹
A change of economic policy however, would alleviate the crisis and improve the patient’s health. This could include measures such as:
In practice, none of the above measures are likely to be adopted under the status quo. Instead, new creative ideas continue to be announced by the government, including the upcoming issuance of a new cryptocurrency, the ‘petro’, to be backed by oil in an attempt to alleviate its current cash crunch.
An alternative creative idea that I have come up with, is the establishment of a citizenship by investment program (CBI), similar to the existing ones below.
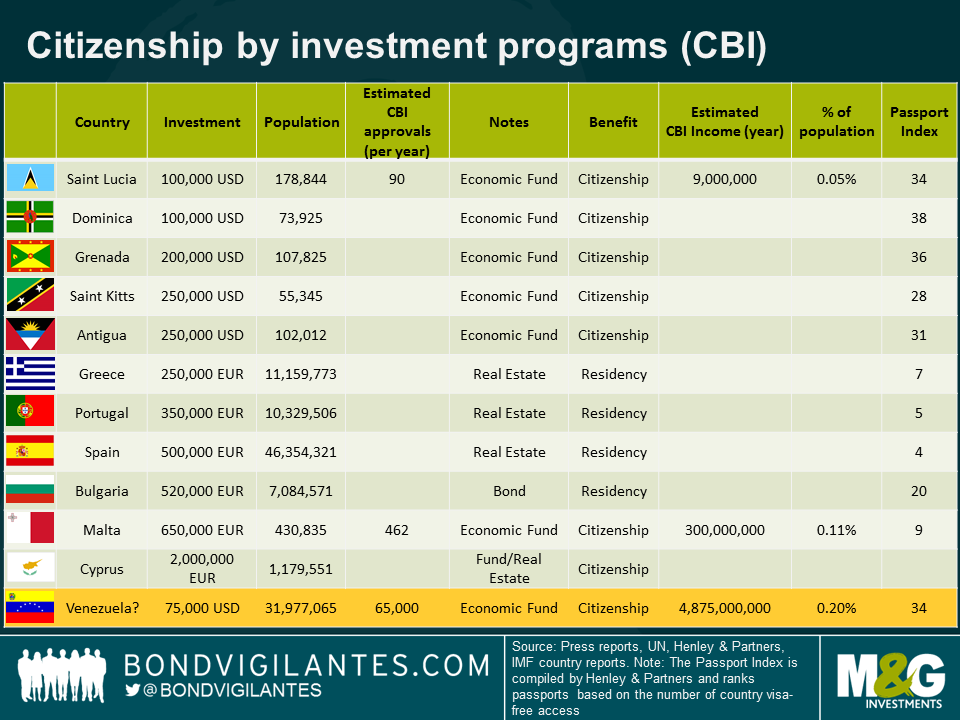
The requirements for each country vary, sometimes including residency conditions, but always requiring an investment into a government run fund, real estate and/or bonds. Some countries provide temporary residency, with an eventual citizenship possible though not automatic (i.e. certain EU countries with the exception of Malta and Cyprus). The revenues from such programs can be material. Dominica’s, for example, exceeds 5% of GDP, while St Kitts has fallen to around 4% (revenues were over 12% of GDP at inception).
A Venezuelan passport is attractive as it entitles the holder to visa-free travel to over 130 countries, including the European Union and it ranks a not-too-shabby 34th place globally, ranking higher than Peru, Colombia and Panama. See other rankings for passports here. I assume that a Venezuelan program would not require residency in the country but would require a monetary contribution for the equivalent of $75,000. This level is slightly lower than that of its neighbouring Caribbean countries due to perceived higher risk (e.g. additional US sanctions or controversy, risk of changes on visa requirements (i.e. EU’s Schengen area) if the vetting process is perceived to be too lax, past controversies in alleged sales of passports to terrorists, etc). I also estimate the external financing gap for Venezuela in 2018 at around $4.9 billion. This assumes an oil price of $50 for the PDVSA mix and total production of 2 million of barrels per day. Given that a large portion of the production is already pre-committed to China, Russia and Cuba and assuming domestic oil consumption of around 500-600,000 barrels per day, the actual amount of oil that is exported at market prices is roughly only a third of total production. It also assumes that no further payments will be made on its bonded external debt (Venezuela and PDVSA).
Assuming that each Venezuelan passport raises $75,000, if Venezuela grants 65,000 citizenship applications, it could close its financing gap for this year. Putting the amount into context vis-a-vis the country’s population, that is higher than the estimated amount of passports sold by Saint Lucia or Malta, but not scandalously so. Is this idea feasible? Probably not, but given the desperate cash crunch in Venezuela, one must think outside the box.
[1] Technically, the bonds issued by PDVSA are still trading with accrued interest. The bonds issued by the sovereign, are trading without accrued interest, which is how defaulted instruments normally trade.
It was the best of times, it was the worst of times – to phrase it in a Dickensian way – for bonds of British automotive and aerospace components company GKN. After Melrose Industries, an investment firm specialised in turnarounds of manufacturing businesses, had made an unsolicited takeover bid for GKN on 8th January, GKNLN 3.375 05/12/32s have enjoyed capital gains of 1.7%, whereas the cash price of GKNLN 5.375 09/19/22s has dropped by 2.5%. This divergence seems counterintuitive, considering that both bonds are identical in many aspects: issuer (GKN Holdings Plc), rank within the capital structure (senior unsecured), currency denomination (GBP), credit rating (BBB-), to mention but a few. How is this possible?
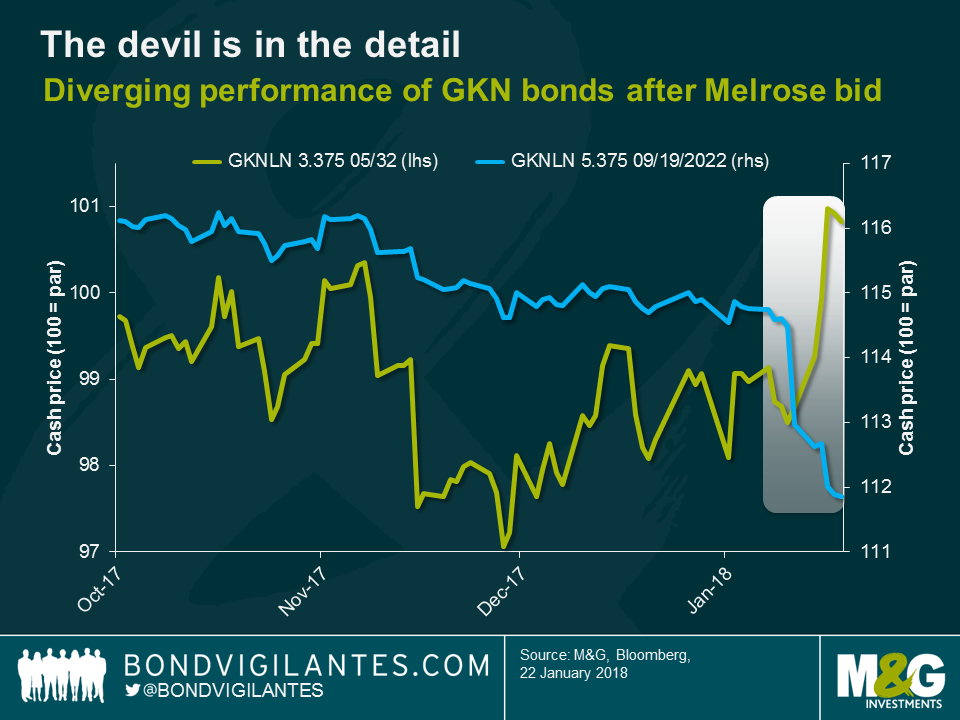
In order to understand the diametrical performance trend, we have to delve into the nitty-gritty details of the bond prospectuses. There are three key differences related to bond covenants, which put holders of GKNLN 32s in a much better position than holders of GKNLN 22s and thus explain the opposing price reactions to the risk of a hostile takeover of GKN by Melrose.
We have written in the past about the importance of bond covenants, which can help protect the interests of investors, and the GKN case serves as yet another reminder. In the current market environment many corporate bonds are essentially priced for perfection and tight credit spreads do not leave much room for error. It is therefore vital for credit investors to do their research to fully understand even the finer details of the bond prospectus. Going the extra mile in terms of in-depth analysis and being fastidious about security selection are likely to be a winning investment strategy.
While you’ve probably heard about President Trump’s success in pushing through a package of tax reforms – arguably his biggest achievement to date – did you know that its requirement for companies to repatriate cash is mandatory? Or, that in most cases this has already taken place? Tune in for this week’s edition of BVTV, where M&G credit analyst Simon Duff gives us the bigger picture of what the reforms mean for the tech and telecoms sector and bond market issuance.
The Financial Times today ran a story that the ONS has admitted errors in its measurement of the telecoms sector. It seems that the ONS has effectively been focussed on output of the telecom sector as based on turnover of the providers, and making a price assumption of the goods and services they sell. On this methodology, the ONS shows prices of telecoms were flat between 2010 and 2015, and turnover of the companies fell slightly, implying the real output of the industry was down 4% over the period. However, this approach fails to recognise huge changes in the quality of the goods and services sold. If prices stayed flat, then the telecom sector would have to be recognised as a productivity leader, similar to computers and computer components manufacturers, over the same period and for the same reasons.
However, if you try to adjust for the vastly improved quality of the hardware (which is surely seen to have improved faster than prices have risen) on the one hand, and on the data speeds and coverage on the other, then we have been in a productivity boom in this area for a number of years. And on top of that, the packages of data and texts and so on that people are now getting for a not dissimilar amount to before show that prices have plummeted on the services side. Putting this together, growth has been underestimated, productivity has been underestimated, and prices have been overstated.
Firstly to give the ONS their dues, this is remarkably similar to the issue that happened in the US in March 2017 when the statistician recognised the dominance of the ‘unlimited data package’ in the US (rather than pay as you go per unit of data up until then), and made a hedonic adjustment to telecoms services prices that bluntly was the single largest catalyst of the low US inflation story in 2017. Yes, larger in influence on US CPI than wages, which are indirect in their effect on CPI, and which were essentially flat in 2017. This will no longer be a negative drag when we get the April inflation data in the US, and is one of a plethora of reasons that may well account for the strong performance in recent months in US breakevens.
We are all used to seeing significant revisions to growth data, and particularly productivity data, and often over long and distant periods of the past. But CPI has never been backwardly revised since its introduction in 1996. It also raises a number of questions, such as what would happen to contracts that are linked to CPI (eg, pensions, pay), and would social security have to be reimbursed by people who were overpaid relative to revised, lower, CPI? These are surely too politically unpalatable to even consider? But if the changes were made from the point of revision to the data, there would then be a potentially large discontinuity between past CPI and present and future CPI. Would the Bank of England, for instance, at the point of revision, have to loosen policy aggressively so as to get new inflation up to 2%? But, in spite of these consequences of improving the data measurement, change for the better must occur. The question, for others, and for another time, is: how?
What might these changes to the inflation history of telecoms do to CPI? For this, as in many instances in the past, I have to turn gratefully as ever to Alan Clarke of Scotiabank, who pointed out the story to me this morning, and who had already run his own very rough numbers. Telephone equipment and services has a weight of 2.5% in CPI, so assuming 50% of that is services, and assuming that prices could be 35% to 90% lower in 2010-15 (as the FT article discusses), CPI could be 9bps to 23bps lower each year.
It may never happen, and if it does is likely not to be until at least 2019. Furthermore, the revisions are likely to only be made to CPI, as the ONS insists that RPI is ‘never revised’. This is important because holders of index-linked gilts earn RPI, not CPI, and the wedge (the amount RPI is from CPI, it can be lower as well as higher!) is assumed to be between 0.75% and 1%. If RPI isn’t changed, the wedge will have to be revised up to 0.85%-1.2%, and breakevens will move up, meaning linkers will outperform conventional gilts. RPI is already subject to criticism for being too high and antiquated, and this will not help matters. So, a slow burner, and one to watch. Mind you, we should recognise the difficulty in measuring this stuff. And perhaps if the quality and quantity adjustments were made properly to my shrinking soups and dry sandwiches around the City of London at the same time, inflation wouldn’t fall, it would actually rise!
After such a good run for credit spreads in 2017, and a more challenging start to the New Year for government bonds in particular, are we right to be more cautious about prospects for markets in 2018? Fund manager Wolfgang Bauer joins me to discuss what’s behind the recent sell-off in bunds and Treasuries, and what we can read into primary market activity so far in January.
Plus, will the ECB still be buying bonds by the end of 2018 and – perhaps even more importantly – will Germany win football’s World Cup? Watch our first episode of the year for Wolfgang’s predictions.
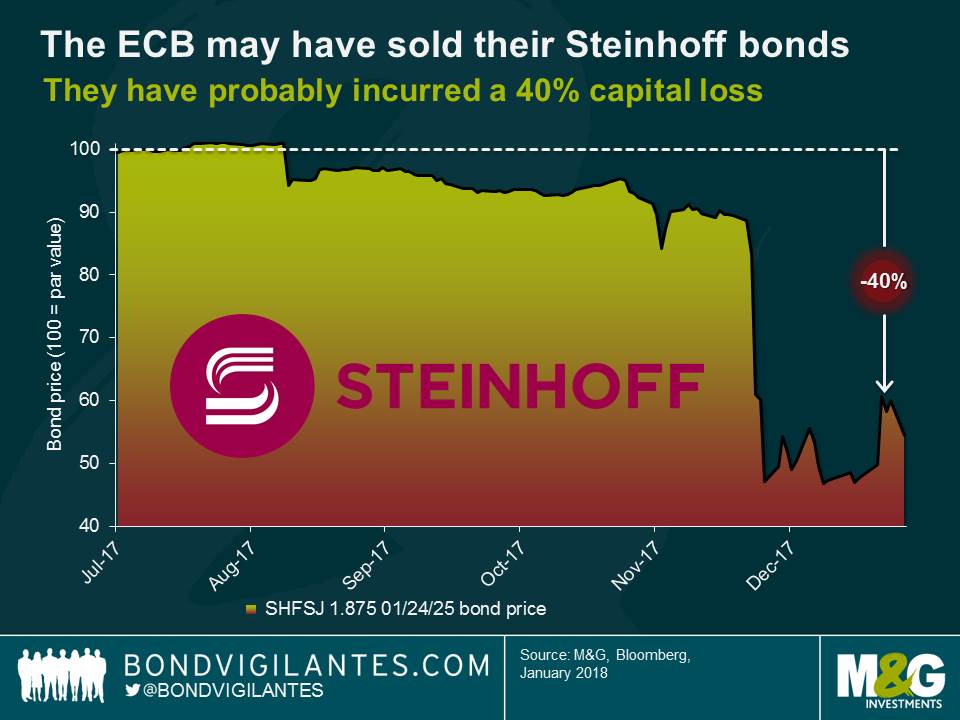
Credit risk is real. It’s easy to forget this platitude in times when both investment grade and high yield credit markets go from strength to strength. Even one of Europe’s foremost credit investors – the European Central Bank (ECB) – has recently been reminded that there is indeed the risk of permanent loss of capital when buying corporate bonds.
Every week the ECB updates the consolidated list of corporate bond holdings which have been accumulated under the Corporate Sector Purchase Programme (CSPP). Yesterday we took a look at the latest CSPP spreadsheet and there was one striking change compared to the prior data release: Steinhoff bonds – SHFSJ 1.875 01/25 (ISIN XS1650590349), to be precise – had vanished. The bonds have not been redeemed, nor has the issuer defaulted. So if it isn’t some sort of clerical error, this would suggest that the ECB has actively and deliberately liquidated its Steinhoff position.
When we say “ECB”, strictly speaking this isn’t true. Bond purchases – and apparently bond sales – are carried out by six national central banks within the Eurosystem. So which central bank actually bought the Steinhoff bonds? Steinhoff is an international retail holding company which owns amongst many other subsidiaries Poundland in the UK. The company was originally founded in Germany in the 1960s but moved headquarters to South Africa in the late 1990s. But all of that doesn’t help you much as the SHFSJ 25s were issued from Steinhoff Europe AG, which is domiciled in Austria. Like other Austrian corporates, Steinhoff bonds fall, rather surprisingly, within the remit of Suomen Pankki or Bank of Finland (BOF), if you prefer. Why is Finland’s central bank buying Austrian bonds, you may wonder. Both Finland and Austria are geographically located at the Eastern fringe of the Eurozone, albeit at very different latitudes, would be our best guess. Anyway, we checked the BOF’s list of CSPP holdings and the SHFSJ 25s disappeared there as well, just like in the consolidated ECB spreadsheet. This supports the presumption that the bonds were indeed actively sold.
Back in late July 2017, when the ECB / BOF first bought the SHFSJ 25s, the bonds had only one weak investment grade (IG) credit rating from Moody’s (Baa3) but were nonetheless CSPP eligible. However, in early December news of accounting irregularities at Steinhoff broke, CEO Markus Jooste resigned with immediate effect and the SHFSJ 25s fell off a cliff. Moody’s reacted by cutting Steinhoff’s credit rating on 7th December by four notches deep into high yield territory to B1, triggering another sell-off which pushed the cash price of the SHFSJ 25s below 50 cents on the euro.
It is important to point out that the loss of IG status, and thus CSPP eligibility, did not automatically make the ECB / BOF a forced seller, though. For instance, the German fertiliser company K+S AG lost its only IG rating in October 2016 after it had been bought under the CSPP. But the Bundesbank continues to hold two of their bonds – SDFGR 3.125 12/06/18 (ISIN XS0997941199) and SDFGR 4.125 12/06/21 (ISIN XS0997941355) – on their books to this day. The Steinhoff case however is a lot more severe. Moody’s lowered the credit rating further on 28th December 2017 to Caa1 which is associated with “very high credit risk”, according to the Moody’s rating scale definitions. It seems that at this point the ECB / BOF got increasingly nervous about a perceived risk of a default or restructuring event and wanted to limit the potential fallout – both financial and reputational. And so it appears that they liquidated their position in early January 2018, even if this meant crystallising significant capital losses.
But how much has the ECB lost on the Steinhoff trade? We can’t say for sure, I’m afraid. We don’t know the exact points in time when the ECB / BOF bought and sold the bonds as holdings are only published on a weekly basis. We don’t know either whether the ECB / BOF scaled their position up or down during the holding period since holding sizes are not published. For the sake of simplicity, let’s assume the bonds were originally bought at issuance at the reoffer price just below par (99.44) and that there was no further trading activity in 2017. The bonds dropped off the lists of the ECB and the BOF on 5th January and 8th January 2018, respectively. Let’s assume the best case scenario which would be a sale on 3rd January at a cash price of around 60 cents on the euro. Under these assumptions, the permanent capital loss incurred by the ECB / BOF would thus be a whopping 40%, which is only very marginally softened by accrued interest of c. 0.8% over the holding period of around five months.
It is impossible to calculate the monetary loss as a euro amount since CSPP holding sizes are not disclosed, as mentioned above. In any case, losses would be dwarfed by the size of the CSPP book, which currently stands at around EUR 132 billion. Furthermore, buying European IG corporates has been very profitable for the ECB. Since the CSPP purchases started in late June 2016, the ICE BofAML EMU Corporate Excluding Banking Index – a rough proxy for the CSPP eligible universe – has generated a total return of around 3.75%.
Finally, are there any lessons to be learnt here? The conclusion is that investors should not treat corporate bonds as risk-free assets. Even for bonds with IG ratings in the current ultra-low default environment there is a non-zero probability of incurring permanent capital losses. It is therefore important and worthwhile to focus on credit fundamentals and in-depth analysis in order to tilt the odds in our favour and increase the likelihood of avoiding the occasional blow-up. As far as the future of the CSPP is concerned, the Steinhoff case might give critics another argument to push for a timely end of the programme.
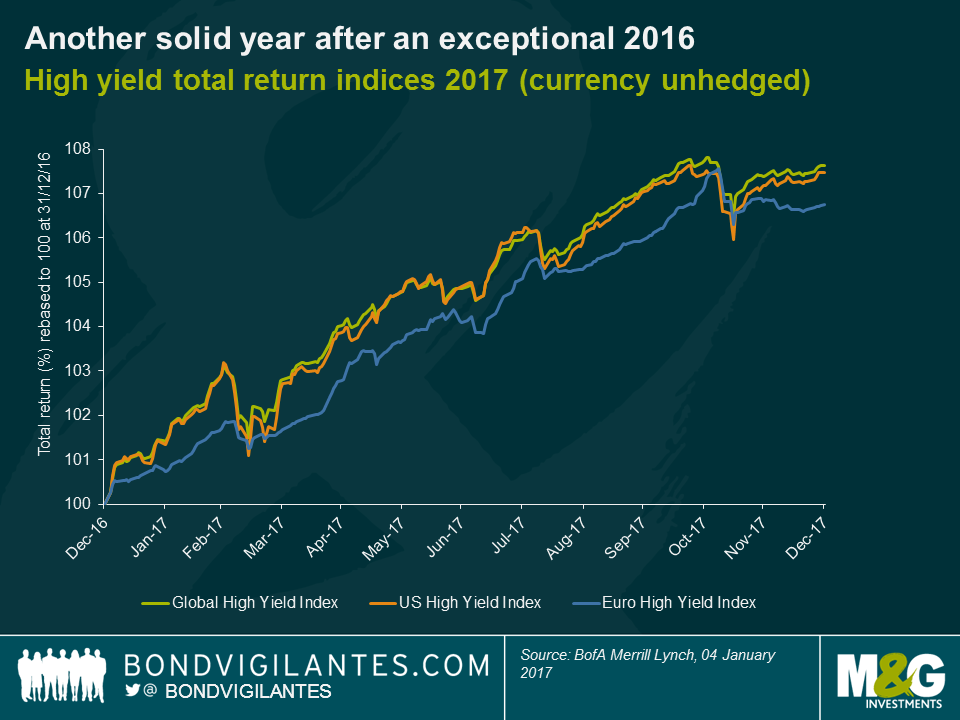
Good performance after an exceptional 2016
2017 was another good year for high yield investors with the global high yield index delivering a total return of 8.0% (in USD terms), albeit this was less exciting than the 16% achieved in 2016. The US continued to outperform Europe but at a far more modest rate compared to 2016, with a 7.5% local currency total return vs Europe’s 6.7%, although much of this can be attributed to the difference between US and Eurozone interest rates. For instance, a fully USD hedged portfolio of European high yield would have returned 8.9%. Global floating rate high yield bonds returned 4.7% in USD terms over 2017 reflecting their lower beta characteristics relative to conventional fixed rate high yield.
Sector winners and losers
Looking at the 7.5% total return in the US, the top 3 performing sectors were Utilities (+11.6%), Banking (+10.8%) and Chemicals (+10.6%) driven by a combination of continued strength in the domestic economy and in the case of the small Utilities sector some credit friendly M&A. In contrast, the worst 3 performers were Consumer Products (+0.3%), Super Retail (+1.3%) and Cable & Satellite (+4.6%) reflecting the persistent erosion of traditional retail profitability in the face of the secular shift toward online retailers (a.k.a. the “Amazon effect”), whilst Cable & Satellite saw underperformance on the back of concerns that the sector has seen peak subscriber growth as non-traditional platforms start to gain meaningful share in the media market (a.k.a the “Netflix effect”).
Within Europe, financials outperformed significantly posting a 9.1% gain in EUR terms, with non-financials modestly lagging with a 6.1% total return. This was a reversal of the trend in 2016, reflecting the bounce back in the sector after some bondholder unfriendly recapitalisations of Italian banks that year. 2017 was a far more benign year for financial risk. Indeed the riskiest bank debt (AT1 / COCO’s) posted a 12.9% return, even after an effective 100% loss for Banco Popular AT1 bondholders during the year.
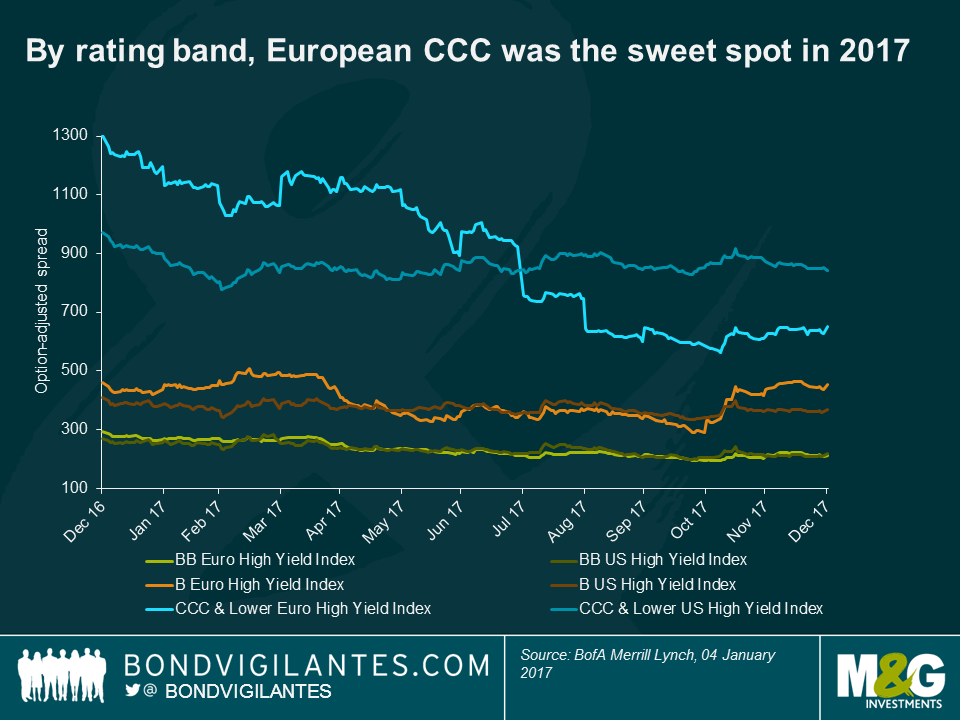
Rating bands performance
On rating bands, the European CCC segment was the clear outperformer with a total return of 13.8% and the pick-up on the CCC spreads vs the single B sector collapsing by 643bps through the year to only 197bps compared to 840bps in January. In contrast, the European single-B index only returned 5.8% with spreads vs European BB actually widening over the year by 74bps to 242bps. The European BB segment returned a solid 6.6% with spreads tightening by 83bps. This is an unusual move as historically single-B’s have tended to outperform BB’s in a rallying market. Part of the reason could be due to the market technical in the wake of the ECB’s QE program – the “spill-over” from investment grade spread performance will have been most noticeable in the BB rated part of the credit market.
In the US, performance was more consistent across rating bands with the spread on all rating categories tightening over the year and a more measured CCC vs single B spread differential than in the European market (YE17: 472bps vs 197bps).
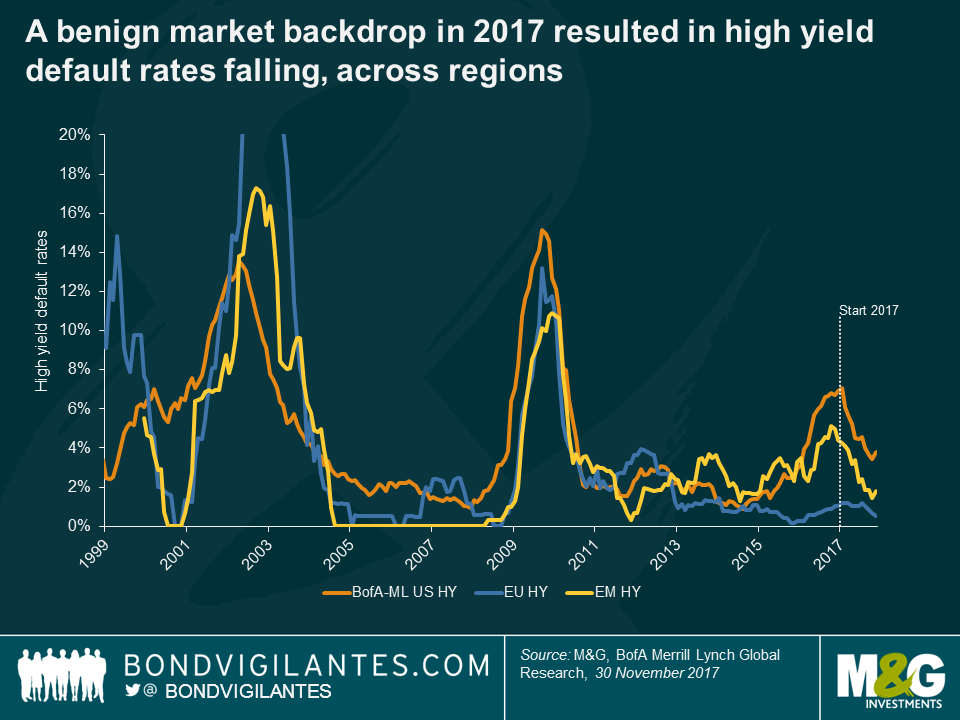
Default rates
Given a benign market backdrop, default rates (as measured by Bank of America Merrill Lynch) fell over the course of 2017 to 3.8% in the US at the end of November 2017 (YE16: 6.9%) and only 0.5% in Europe (YE16: 1.0%). The big fall off in default rates in the US was widely expected as the financial distress in the energy sector rapidly receded. Nevertheless, Energy was still in the top 4 defaulting sectors in the US (alongside Utilities, Media and Retail). Notable bankruptcies included Avaya, Toys R Us, Gymboree, and some Energy/Utilities names, such as Petróleos de Venezuela SA, GenOn Energy and Seadrill.
In Europe, the defaults were rarer and more idiosyncratic in nature including issuers such as paper producer Norske Skog, Croatian food retailer Agrokor, the oil services group CGG, and airlines Air Berlin and Alitalia, (NB the 2 airlines did not have public credit ratings rated and so were excluded from the 0.5% European default rate).
2018 Outlook
So what next for the high yield markets? There is little doubt that underlying economic conditions are as favourable as they have been for many years. Synchronised global growth that has the potential to drive corporate top lines and profitability is good news for the high yield market. This should help support credit spreads and could even push default rates lower (more so in the US than Europe). However, our view is that credit spreads already largely discount this benign scenario and we are seeing little scope for material spread tightening from this point forth – a lot of good news is already in the price. Nevertheless, in relative terms, the high yield markets remain attractive for income seekers with the US market yielding 5.1% and the European market yielding 2.4% (in local currency terms), hence without a major change to the fundamental outlook, the asset class still has its attractions. What we do see, however, is further underlying shifts within the market – the continued ripple effect of technological and social disruption to traditional industries. 2017 saw the “Amazon effect” really start to bite. Could the “Netflix effect” gain momentum in 2018 ? Will we be talking about the “Tesla effect” by the end of the year? All very pertinent questions for active high yield managers in 2018 and beyond.


Sign up to the Bond Vigilantes mailing list to ensure you never miss a great article from our expert Bloggers. We will email all new articles to your inbox, meaning you can stay on top of the world of Bonds.
I confirm that I would like to receive information about Bond Vigilantes and products and services from M&G Securities Limited.
We will use the email address and personal data you have shared with us to send you this information. For existing customers, submitting your contact details and requesting to receive this information from us, will replace any earlier choices you have made in respect of marketing information.
You can unsubscribe from marketing at any time, at which point we will not send any further marketing information to you, by selecting the unsubscribe link in all communications.


