Markets
Gold prices: beyond inflation and real yields
By Robert Burrows
25 April 2024

On 22nd December last year, President Trump enacted probably the most significant achievement to date of his presidency by signing the Tax Cuts & Jobs Act of 2017. The precise implications of tax law changes can be fiendishly complicated and difficult to assess due to the numbing complexity of the legislation and individual companies’ tax planning arrangements. However, in broad strokes, I believe that US businesses will benefit from a significantly lower tax burden on their domestic earnings and an even larger reduction in tax levied on the repatriation of any of the estimated $3 trillion of overseas profits that are currently held offshore by US corporates.
On repatriation of foreign earnings, the big winners are the highly cash generative international tech and pharmaceutical players who will now only suffer a 15.5% charge vs 35% previously. As an example, Apple alone has $252bn of gross cash and securities held overseas whilst Johnson & Johnson holds $41bn outside the US. However, my focus in this article is the impact the tax changes will have on the ongoing earnings and cash flow of the largely domestic-focused US telco and cable industry.
The main drivers for the reduction in the domestic tax burden will be a cut in the corporate tax rate from 35% to 21% on a permanent basis combined with an increase in the tax deductibility of upfront tangible asset investment (so called “bonus depreciation”) from 50% of the total cost to 100% until 2022 with a 20% per annum tapering off thereafter until 2027. Offsetting this will be restrictions on the deductibility of interest against tax (only 30% of taxable income) and offsetting accumulated operating losses (80% in perpetuity vs previous 100% with a 20-year limit), but I see these as far outweighed by the former cuts.
The biggest winners under this new framework will be the larger investment grade telecom and cable operators that currently pay tax at or near the full 35% rate and make significant annual capital investments in telecom and cable infrastructure. Specifically, we see Verizon, AT&T and Comcast as the big winners based on their respective YE16 corporate tax burdens ($6bn, $4bn and $4bn respectively) which were forecast to rise further from 2017 on a combination of profit growth and/or acquisitions. Estimates of the positive cash flow effect of the reduced tax burden range between $3-5bn for these names and although I expect a significant proportion to be allocated to shareholder returns, I also gain significant comfort from the material increase in ongoing underlying free cash flow that can be directed to accelerate debt reduction if required.
So are there any losers in the telecom and cable universe from these changes? Not really. There is limited upside from the reduced tax rate due to the more indebted high yield operators already paying little or no tax. However, there is also limited downside risk to high yield operators’ debt tax shields due to a combination of cash interest burdens being at or below the 30% of taxable income threshold or, in the case of those that might exceed this threshold (most notably Frontier and Altice’s Optimum and Suddenlink credit silos), the existence of significant accumulated net operating losses that are now indefinite vs the previous 20-year limit. I therefore see virtually no impact on the free cash flow (FCF) of leveraged high yield telco and cable operators.
All in all, I therefore have a positive view of the Trump tax reforms with the large operators on the cusp of a material increase in FCF and the more indebted leveraged operators at little risk of losing their existing interest and operating loss tax shields. So it really will be a Happy New Tax Year for US telecom and media companies thanks to Santa Trump’s Christmas gift.
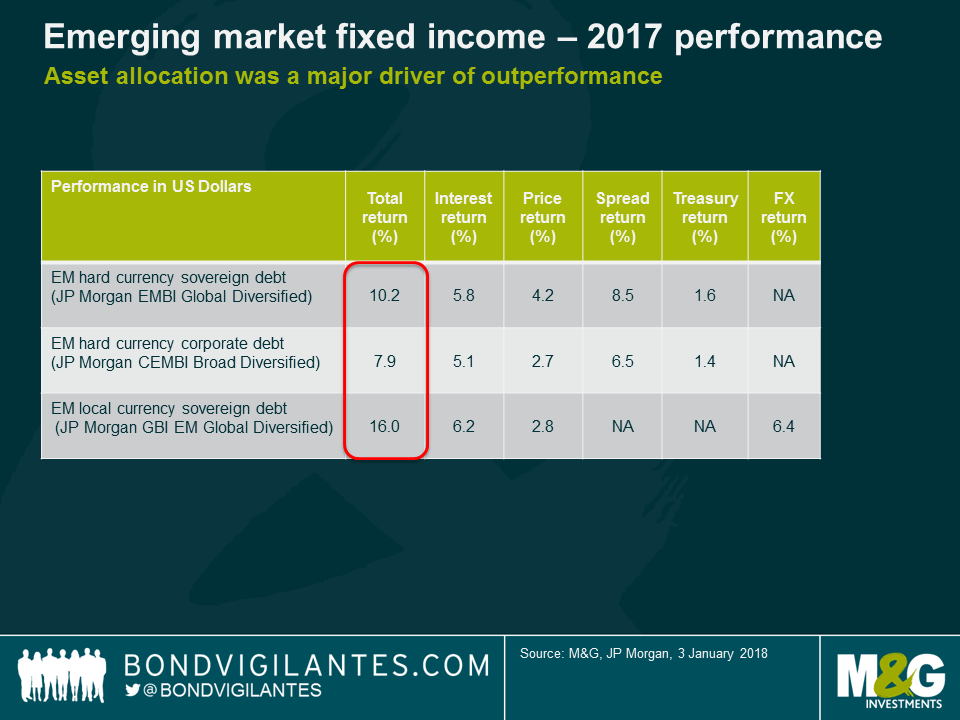
Emerging markets debt posted strong returns in 2017, driven by the stabilisation of fundamentals, ongoing global and EM economic recovery, a small rebound in commodity prices and a geopolitical environment in which the usual suspects (Trump, North Korea, China) have behaved in a more benign fashion thus far. One had to struggle to find an asset that produced negative returns and the only two that did, Venezuela and Turkish local bonds, reflected very different idiosyncratic factors.
Here is a recap of what happened last year and some views for the year ahead:
The US Dollar peaked exactly at the beginning of the year, which allowed EM local currencies to perform well. Developed currencies also posted strong returns versus the US Dollar, particularly the Euro, as the market priced out a more hawkish Fed and a stronger fiscal stimulus in the US and the continuation of a broad based recovery in Eurozone growth. This, combined with a small uptick in commodity prices and disinflation in many EM countries, allowed most currencies to rally versus the US Dollar, though many did not outperform the Euro.
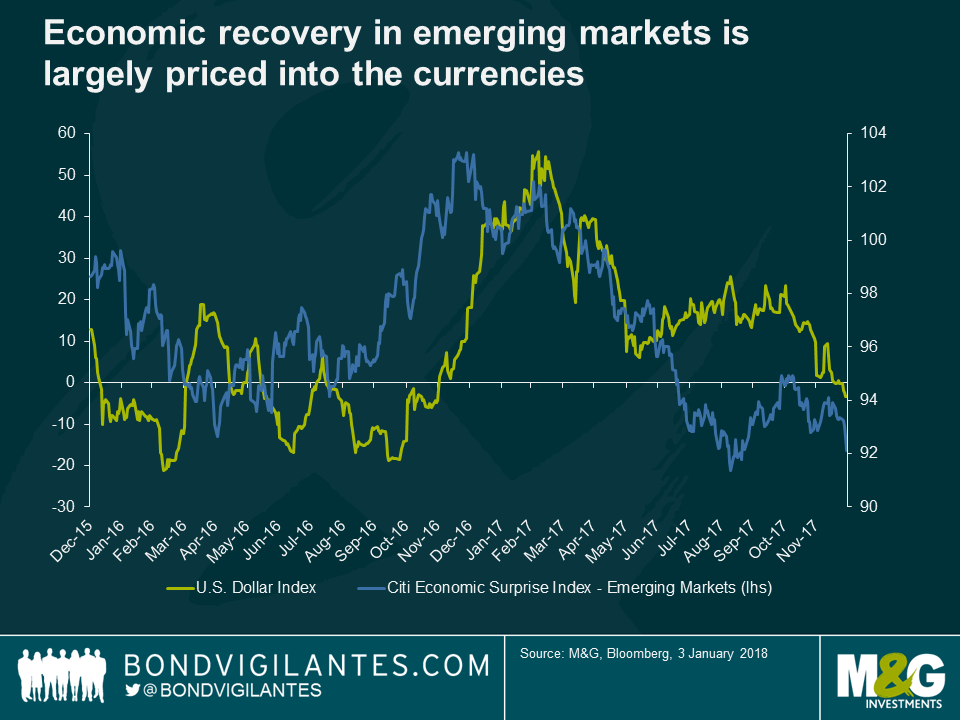
For 2018, local markets may still outperform external debt given relative valuations on both, but I expect lower returns in 2018 as a fair amount of good news has been priced into EM assets. The chart above shows that economic data surprises in EM are moderating, meaning that the uplift in growth that we have been highlighting for over a year may be mostly priced in by now. Additionally, the disinflation we have seen in several EM countries in 2017 (Brazil, Russia, Colombia, etc.) is unlikely to extend into 2018 as the base effects fade away and the bulk of policy rate easing in EM is behind us. Finally, should the Fed prove to be behind the curve (2-3 hikes are currently priced in for 2018), this is not yet priced in and would provide support for the US Dollar.
EM corporates underperformed, partly due to their lower duration than EM sovereigns but also due to their increasing investment grade component, which will normally underperform in a rally. Chinese investment grade credits continued growing in importance due to strong supply and demand from onshore investors.
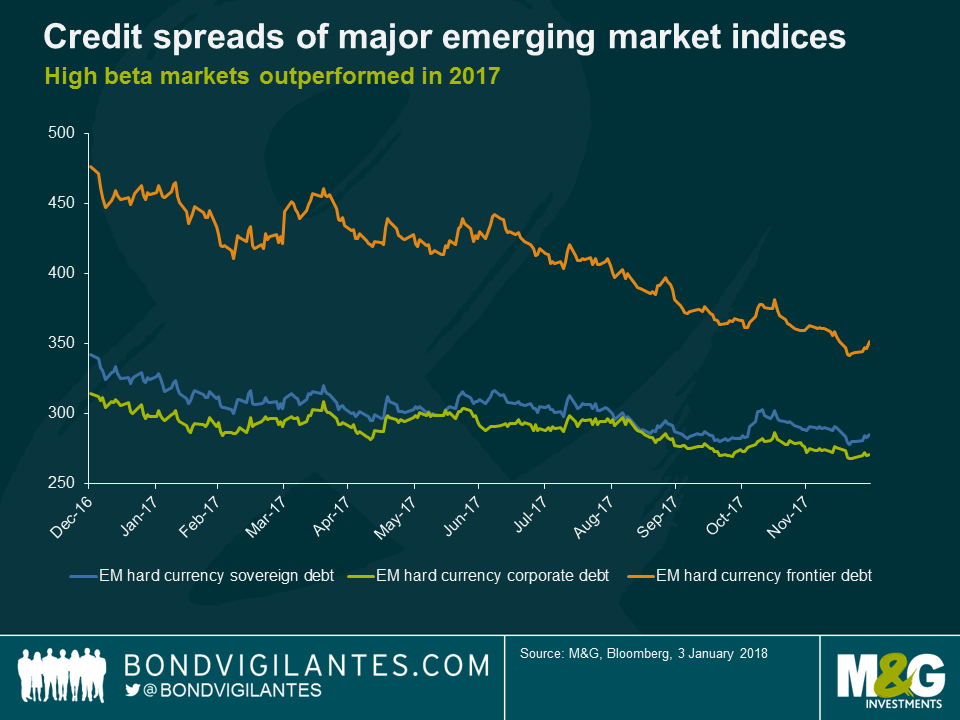
The higher beta countries outperformed and the performance of their proxy, the EM frontier index, returned 15.7%, pretty much in line with the returns on local market bonds. With the exception of distressed credits (Belize on the upside and Venezuela on the downside), returns were often similar for countries whose fundamentals are improving (e.g. Egypt or Jamaica), as well as the ones that are deteriorating (e.g. Tunisia or Costa Rica).

This reflects some indiscriminate hunt for yield and beta and the need to remain invested, as inflows into the asset class have persisted through the year. A few elections (Mexico, Brazil being the most pertinent) will shape the direction of those countries that happen to be at a critical juncture.
Looking ahead into 2018, this may still continue as long as the inflows remain steady, but I expect to see more differentiation of returns given that we are starting from tighter valuations. In other words, beta will still be an important call in 2018, but alpha should become more relevant again after a relatively muted 2017.
The strong returns we saw in 2017 are unlikely to be repeated in 2018. However, should the tail-risks (US economic policy and the Fed, China, geopolitical risks and EM elections, etc.) remain on the backburner and volatility remain contained, the EM carry of 5.5-6.5% is not too shabby, especially considering the investment alternatives in other parts of global fixed income.
Happy New Year to you all. Thank you for another bumper crop of entries for our Christmas quiz. This year’s winner and new reigning champion is Adam Begg of UBS Investment Bank. Many congratulations. As you know, this year we donated £500 to Cancer Research UK in lieu of a trophy. Via CASCAID, the fund management community in the UK this year decided to try to raise £1 million for Cancer Research UK and I’m very happy to say that it hit, and more than doubled that target. The totaliser now stands at £2.25 million. The money that you all kindly donated will do good. Thanks very much. If you enjoyed the quiz and wanted to bung a fiver into the pot, here’s your very last chance to do so: https://uk.virginmoneygiving.com/fundraiser-display/showROFundraiserPage?userUrl=JimLeaviss&faId=772830&isTeam=false.
Second place went to Michael Haslam of Barclays Investment Solutions, and third was Grant Robertson of Kuwait Investment Office. Well done.
Right, the answers:
Have a great 2018.
Let’s be honest, 2017 won’t go down in history as the most exciting year for investment grade (IG) credit markets. IG credit spreads have moved more or less in one direction only: lower and lower. Still, there are valuable lessons to be learnt. Here are our key takeaways.
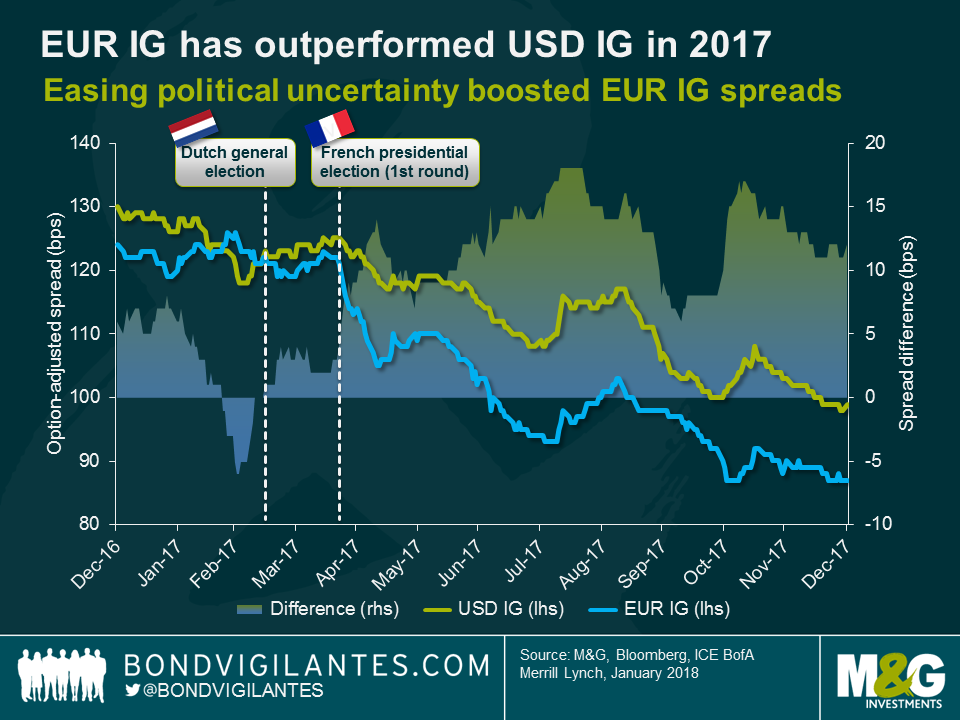
Positive mood swing in Europe drove EUR IG outperformance vs USD IG.
Back in early 2017 the logic was as follows: After the Brexit referendum in the UK and Donald Trump’s electoral victory in the US, populist anti-establishment movements would likely gain momentum in continental Europe too and exert strong centrifugal forces on the Eurozone and the European Union. Consequently, EUR IG credit spreads initially struggled and underperformed against USD IG spreads in the first two months of the year. However, sentiment around European risk assets took a sharp turn for the better when political risks subsided with the Dutch and French election results. After Emmanuel Macron’s victory over Marine Le Pen in France, EUR IG credit spreads were off to the races. Over the course of the whole year they tightened by 37 bps, outperforming USD IG spreads (31 bps tighter). Moreover, EUR IG credit was of course also supported by the European Central Bank’s Corporate Sector Purchase Programme. GBP IG spreads had a good year as well (26 bps tighter) but underperformed against USD and EUR IG, which isn’t overly surprising considering the lingering uncertainties around Brexit.
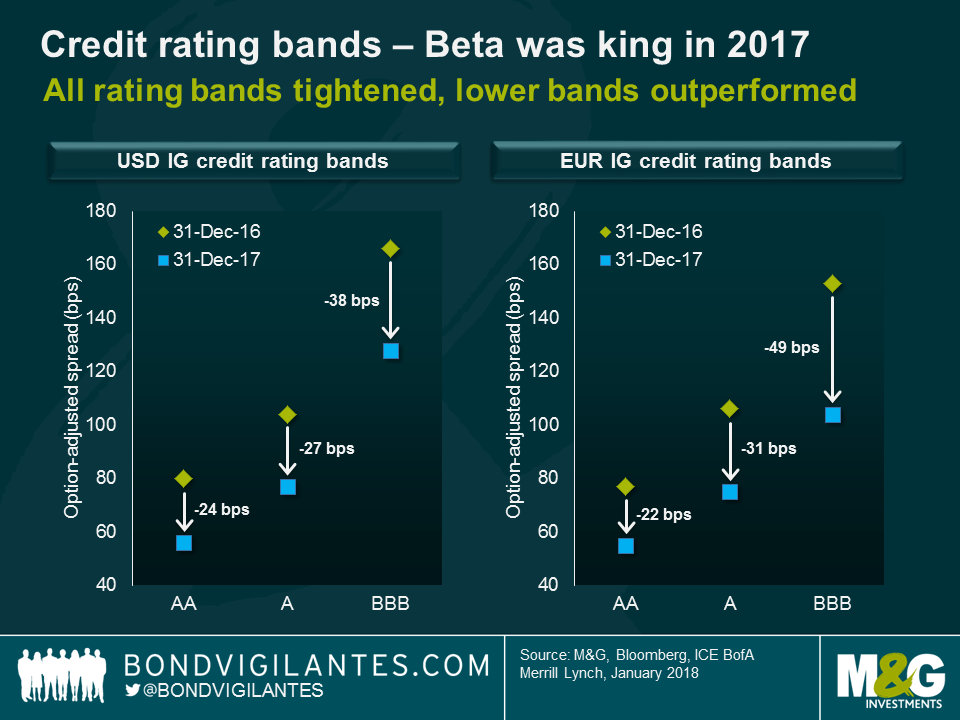
High-beta credit positions, such as lower credit rating bands, generally outperformed.
In the “risk-on” year 2017, high-beta credit strategies generally outperformed low-beta approaches. Consequently, while all USD and EUR IG credit rating bands exhibited spread tightening, BBBs outperformed Single-As which in turn outperformed AAs. It is worth highlighting that EUR BBBs had a particularly strong year, tightening by 49 bps. And within the EUR BBB rating band again the highest-beta segment, the BBB- category, showed the strongest tightening (70 bps).
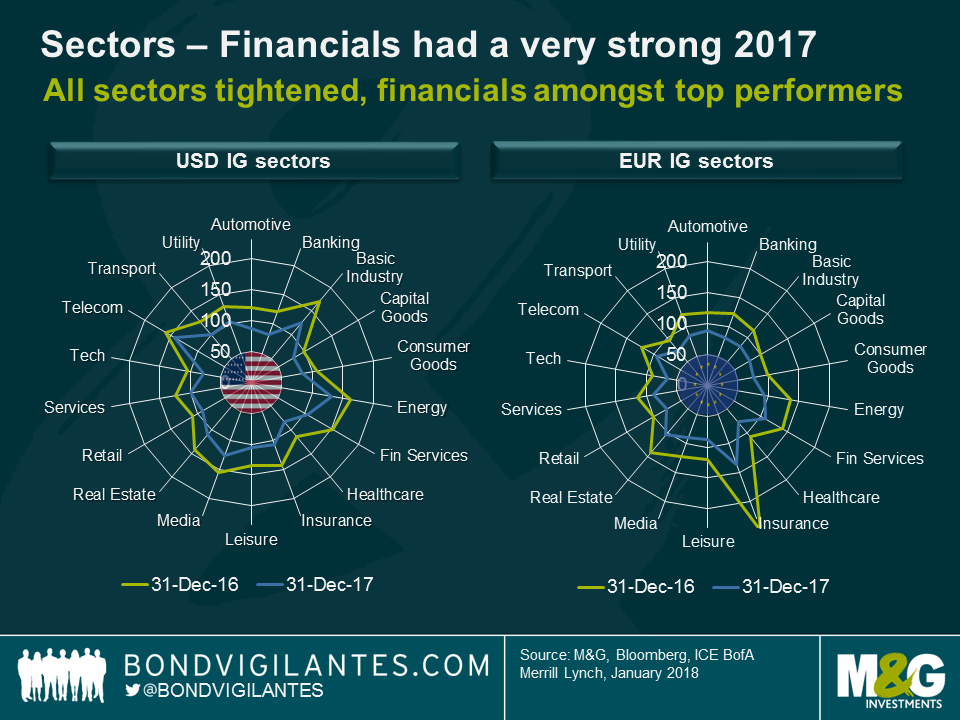
All sectors showed spread tightening; financials in particular had a very strong year.
One of the most remarkable features of IG credit in 2017 is that the spread of every single sector has tightened over the course of the year, both in USD and EUR IG. Financials had a particularly strong year. Banking spreads tightened by 39 bps in USD IG and by 41 bps tighter in EUR IG. Insurance spreads finished the year 35 bps lower in USD IG and were the stand-out performer in EUR IG with a whopping 113 bps tightening. The EUR IG insurance segment contains a very high proportion of subordinated and junior subordinated bonds (c. 64% combined, as of 31st December 2017), which as higher-beta instruments benefitted significantly from the bullish risk-on market sentiment. Apart from financials, other cyclical sectors performed strongly in 2017 too, namely basic industry (44 bps tighter in USD IG, 33 bps tighter in EUR IG) and energy (32 bps tighter in USD IG, 42 bps tighter in EUR IG). Some of the more defensive sectors, e.g., capital goods (19 bps tighter in USD IG, 21 bps tighter in EUR IG) and consumer goods (22 bps tighter in USD IG, 23 bps tighter in EUR IG), tightened less meaningfully.
2018 outlook
Given how tight credit spreads have become, what can we expect from IG corporate bonds in 2018? While a repetition of last year’s strong performance doesn’t seem particularly realistic, there are reasons to stay invested in IG credit. Economic growth and company profits are robust in most parts of the world. Corporate default rates remain at ultra-low levels. Although many central banks have begun to gently reduce stimulus, monetary policies are still very accommodative compared to previous cycles.
That being said, I would not expect a smooth ride to ever tighter credit spreads. Volatility could easily pick up due to a number of lingering political risks – Italian general elections, Brexit negotiations and US mid-term elections, just to mention a few. Therefore, scaling back credit risk by switching into higher credit quality and more defensive sectors or by buying protection on credit default swap indices to reduce credit market beta, seems prudent at this point. There will likely be better buying opportunities for IG credit over the course of the year. Finally, as pure credit market beta is now less attractively priced than one year ago, outperformance this year may well be primarily driven by fundamental credit analysis and idiosyncratic bottom-up stock picking.


Sign up to the Bond Vigilantes mailing list to ensure you never miss a great article from our expert Bloggers. We will email all new articles to your inbox, meaning you can stay on top of the world of Bonds.
I confirm that I would like to receive information about Bond Vigilantes and products and services from M&G Securities Limited.
We will use the email address and personal data you have shared with us to send you this information. For existing customers, submitting your contact details and requesting to receive this information from us, will replace any earlier choices you have made in respect of marketing information.
You can unsubscribe from marketing at any time, at which point we will not send any further marketing information to you, by selecting the unsubscribe link in all communications.