
Rolldown
A dispatch from the number crunchers – Yield curve rolldown
By Matthew Russell
15 April 2026

This morning on BVTV I look at a couple of hot topics we’ve been discussing in recent meetings. Firstly, is it the market rather than the Fed that has been behind the curve? Secondly, in the UK, has the Bank of England’s thinking on Brexit changed in recent weeks? And in both cases, what does this mean for rate hike expectations?
With the European economy growing at its fastest pace for a decade – and with Italy itself seeing an impressive return to growth – the uncertainty of an Italian election is something investors will be keeping a close eye on. The country goes to the polls on 4 March, although the outcome is unpredictable with many observers expecting a hung parliament and no outright winner.
To discuss the potential ramifications of all this I am joined in the studio by our resident Italians, Carlo Putti from our fixed interest team and Graziano Creperio from our multi-asset team. We will consider some of the key risks that investors need to keep in mind, as well as some of the potential investment opportunities that could present themselves both leading up to and after the vote.
In its 2016 Annual Report entitled ‘making tomorrow a better place’, Carillion claimed they had ‘a good platform from which to develop the business in 2017’. Less than ten months after publication, Carillion went into compulsory liquidation, bypassing administration and the chance to continue trading. Assets will be realised and distributed to creditors, leaving little or no value remaining. But could this have been foreseen?
Carillion describe themselves as a leading integrated support service company with extensive portfolio of Public Private Partnership and construction contracts. At the time of the preliminary 2016 results release, Carillion reported cash conversion of 117% and net debt/ EBITDA (Earnings before interest tax depreciation and amortisation – a measure of cash flow) of 0.8x. These measures alone might have suggested an investment grade credit profile, with a relatively low probability of default, but delving deeper reveals a different story.
Carillion defined cash conversion as underlying cash inflow from operations divided by underlying profit from operations. The former includes movements in working capital, used to fund day-to-day operations. Whilst net movement in working capital did not flag anything unusual, it was clear that the deterioration in receivables during the year (£339m movement) was largely being funded by increasing payables (£342m movement), leading to stretched working capital.
Exacerbating the situation, Carillion introduced a reverse factoring Early Payment Facility (EPF – a form of supply chain finance) in 2013 allowing them to extend (almost doubling) payment terms to suppliers up to 120 days. As part of the facility, Carillion’s banks would pay suppliers first before recovering from Carillion thereafter, effectively creating a debt-like short term creditor in the balance sheet.
Whilst the use of reverse factoring facilities by contractors is not unusual, the EPF was optically improving reported cashflow without increasing debt, when in practice it was effectively doing the opposite. Furthermore, cash conversion as reported by Carillion was a poor indicator of the cash situation of the business. A better measure to analyse was absolute free cash flow; taking into account cash spent on capital expenditure, interest, tax, pension contributions, dividends and acquisitions. This would have revealed Carillion were burning through cash in two of the last four years 2013-2016.
The extent to which the EPF was a symptom of Carillion’s malaise or a cause can be debated, however, as the EPF would be invalid should supplier or Carillion become insolvent, it was certainly entwined in the ultimate collapse. Ironically, the two sole references to the EPF in the Annual Report mentioned only the ‘positive’ impact the facility had on suppliers.
At face value, net leverage appeared low in the 2016 report, comfortably inside banking covenants set at 3.5x. A truer picture of Carillion’s liabilities, however, should arguably have included the other creditors created by the EPF, and the pension deficit, which itself had more than doubled during the course of 2016. Viewed in this way, the deterioration of the balance sheet is more readily apparent.
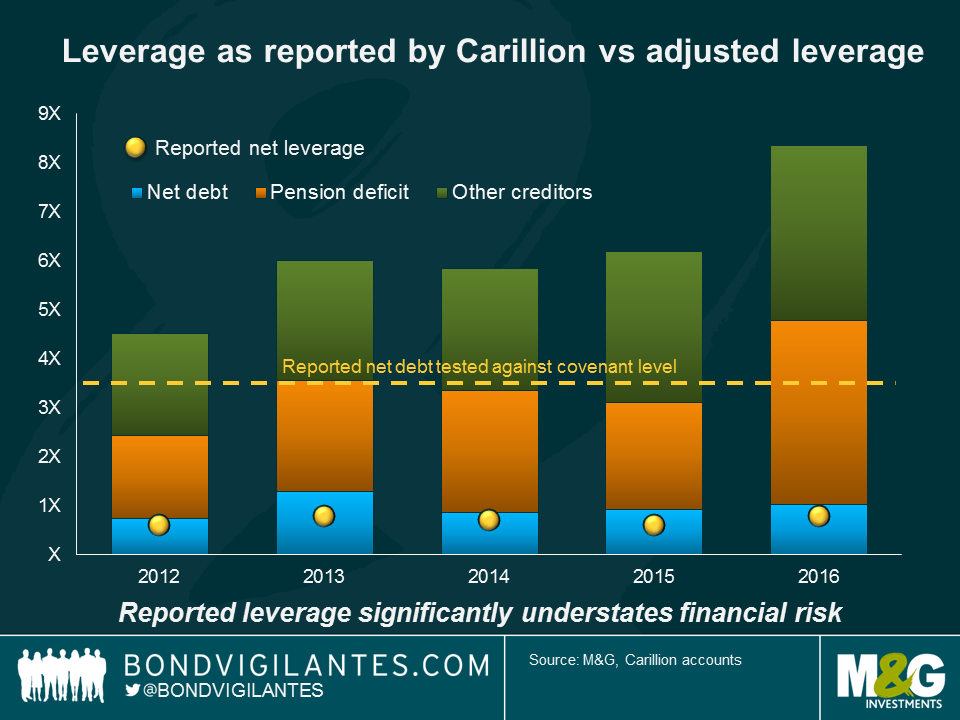
The dust is still settling on the company failure, as stakeholders, including the government, grapple with what went wrong and how it could have been averted. A complex combination of factors played a role, beside the cash and leverage features mentioned, including contract accounting, thin profitability margins, generous dividend pay-outs to shareholders, and intangibles on balance sheet which dwarfed equity leaving them vulnerable to write-downs. The lesson for investors, meanwhile, is that reported numbers rarely reveal the whole picture. Investors need to get into the details of the financials to better understand the true economics of a business.
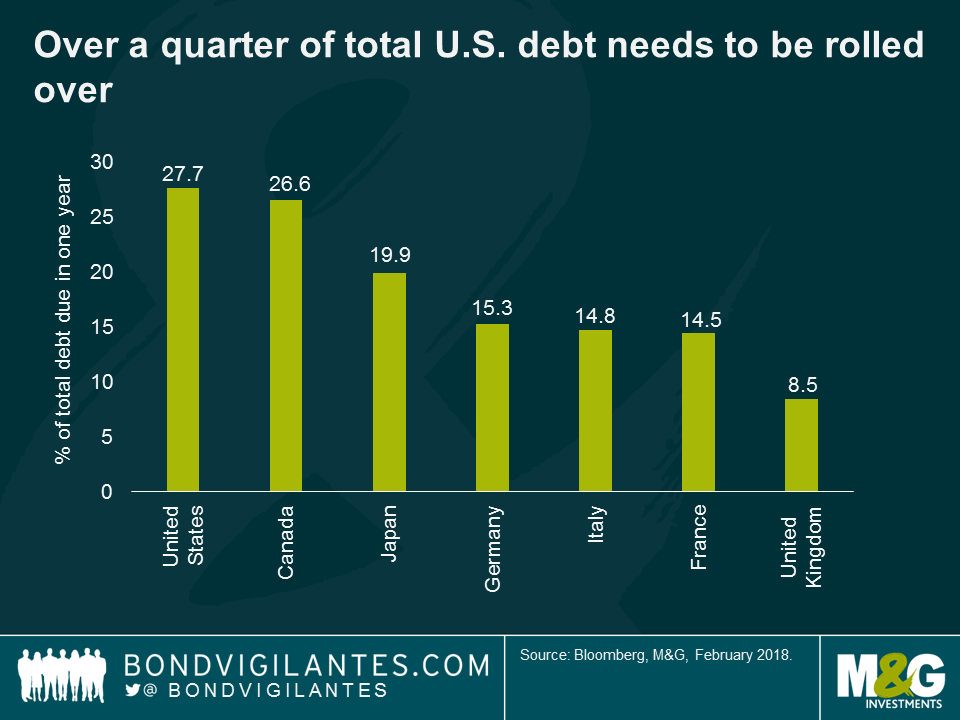
The United States government routinely finances itself through short-term debt, which is normally less expensive than long-term debt, due to the upward sloping nature of the U.S. yield curve. This cost saving does increase the risk of default. Rollover risk arises any time short-term debt is used to finance long-term spending. It is what keeps debt management officials up at night.
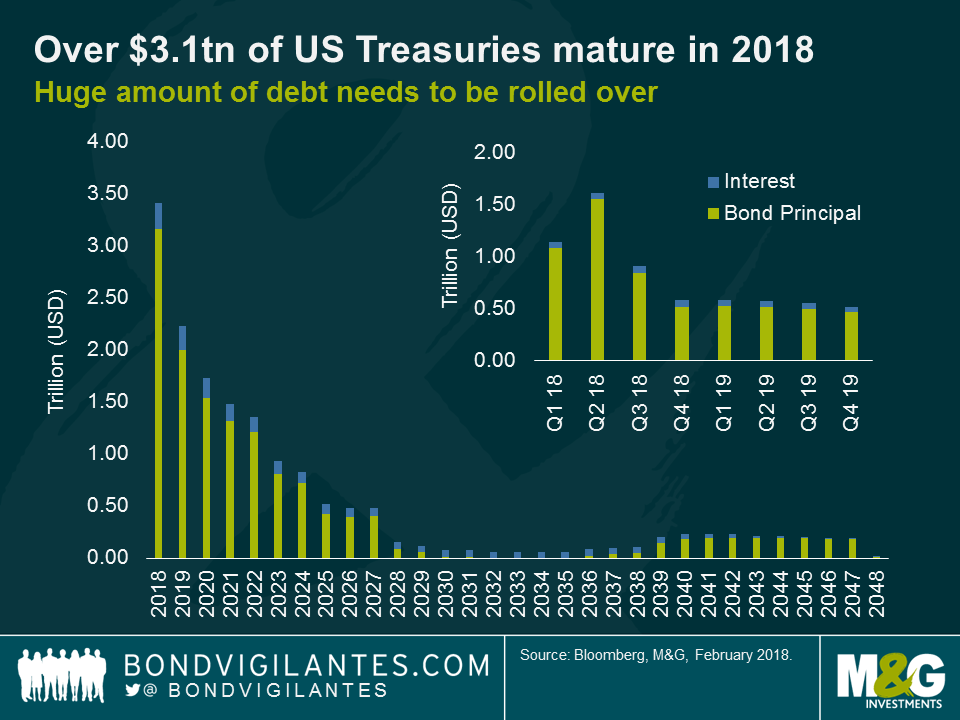
The U.S. government will have to rollover 28% of its total debt in 2018, equivalent to over $3 trillion in U.S. Treasuries. In addition, some estimates suggest that the US federal budget deficit is on track to rise to over $1 trillion in 2019. With the Trump fiscal expansion plans likely to be funded by the issuance of short-term debt, the next few years will see a large increase in U.S. Treasury supply.
The conventional wisdom suggests that the risk of a rollover crisis for the US is close to zero. The U.S. has special status as having the world’s deepest and most liquid government bond market in the world, and the U.S. dollar is the world’s reserve currency.
Whilst the risk of a rollover crisis is low, there are several factors that suggest Treasury yields must move higher from current levels to attract capital from investors. Firstly, senior Chinese government officials have reportedly recommended that the Chinese government reduce or stop buying U.S. Treasuries. With the markets already dealing with supply indigestion, the removal of a large buyer of U.S. Treasuries would likely see yields move sharply higher.
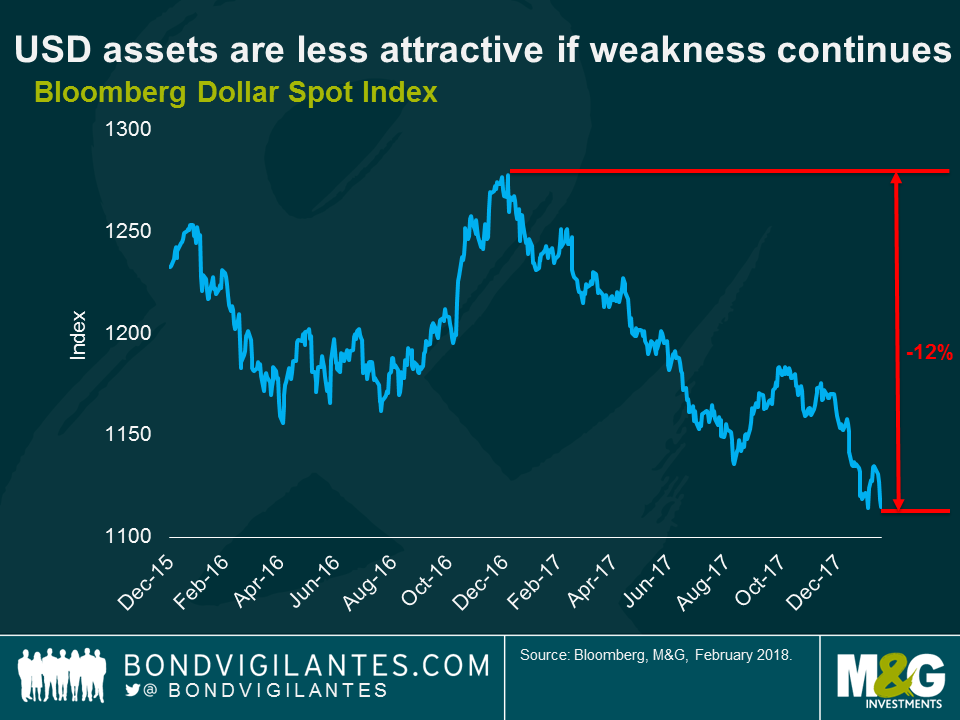
Secondly, the Bloomberg Dollar Spot Index has fallen by around -12% since the start of 2017. If foreign investors expect the U.S. dollar to continue to depreciate, then non-residents will look to reduce or stop the rate at which they accumulate U.S. assets and U.S. Treasuries going forward. This is exactly what the Chinese are reviewing, and we can expect other international governments and large institutions (like sovereign wealth funds) to follow. If this occurs, it will put further pressure on the U.S. Dollar and yields on U.S. Treasuries across all maturities will begin to rise.
Finally, the US has been able to get away with rolling over its debt since the financial crisis through monetising its debt. The U.S. Fed has engaged in quantitative easing (QE) by buying Treasury securities directly, thereby reducing the government’s cost of borrowing. However, QE is now over, and the Fed is hiking rates to cool a rapidly heating economy.
Whilst there are good fundamental reasons for yields moving higher, the huge amount of debt that the U.S. Treasury will have to issue this year and next, at a time of monetary policy tightening, will provide an important technical headwind for U.S. Treasury returns this year.
After a rollercoaster week for equity markets, which saw the VIX volatility index spike to one of its highest ever levels, I’m joined this morning by Craig Moran, fund manager in M&G’s multi asset team. Tune in as we discuss what drove the correction, whether it’s likely to prove a short term risk-off event or a longer-term market reversal, and how much further equities can potentially rally, given government bond yield levels today.
Some of the worst performing bonds in the European high yield index in 2017 all had weak Environmental, Social, and Governance (ESG) scores according to MSCI. Is this is a coincidence or is it indicative of a relationship between poor ESG metrics and bond performance?
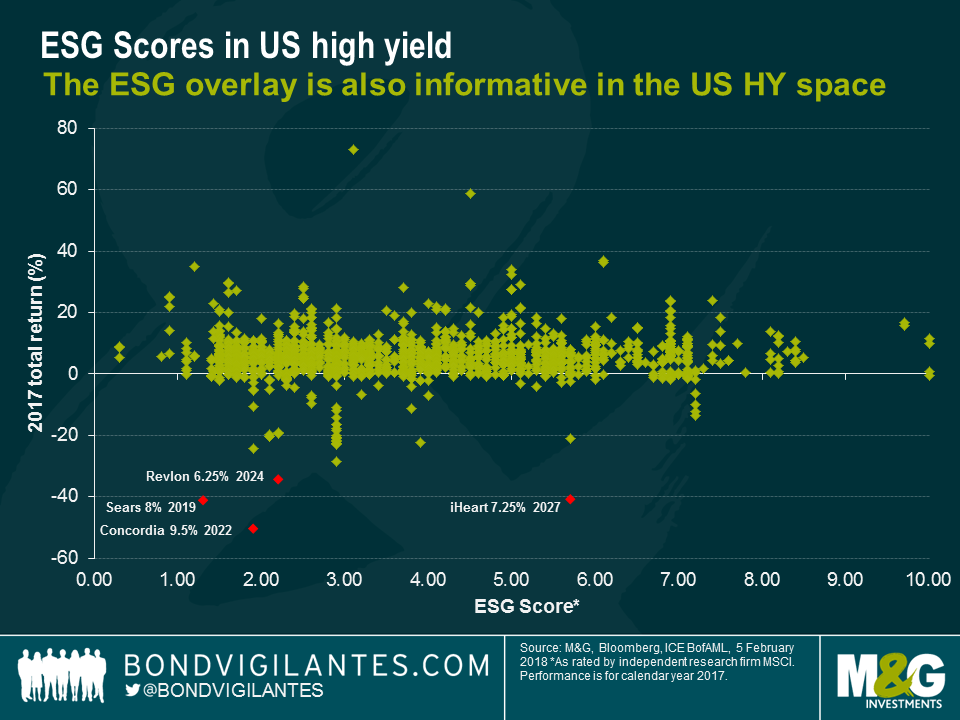
To find out the answer, we analysed the 2017 total returns of the 365 bonds in the European high yield market that were ESG rated by MSCI. Our analysis suggests that returns were not correlated with ESG scores, with a correlation of less than 0.1.

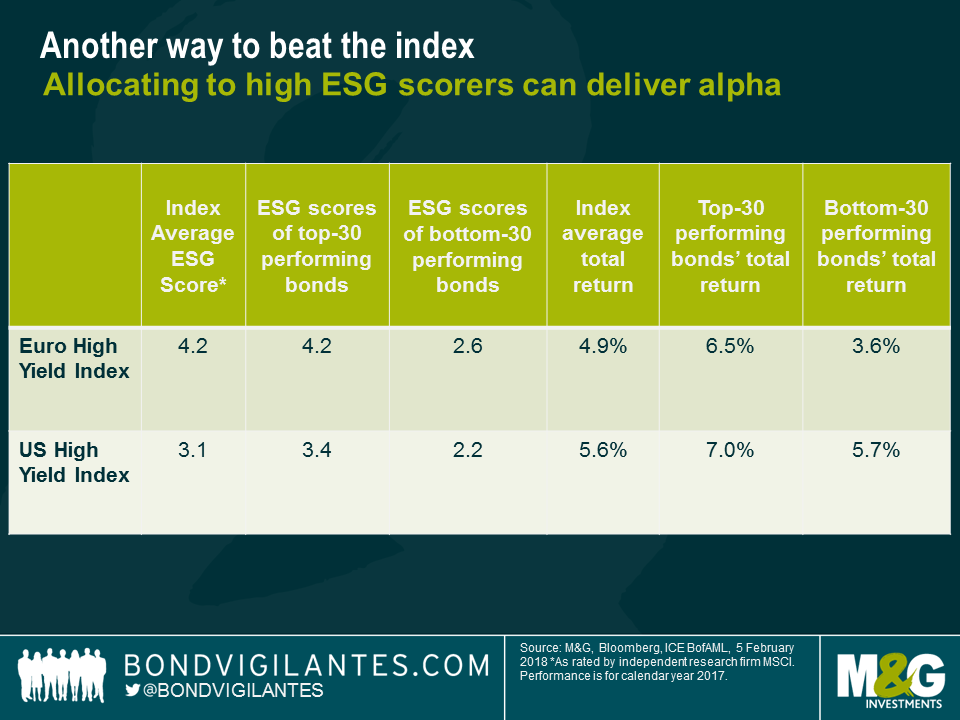
However, despite the wide dispersion of bonds in the chart above, it is still obvious that the three worst performers all have poor ESG scores. Expanding the analysis to examine the 30 bonds with the worst total return, we saw that their index weighted average ESG score was only 2.6 on a scale of 1-10 compared to a 4.2 weighted average for the index. In contrast, the 30 bonds with the best performance over the same period had a weighted average of 4.2, in line with the index. There appears to be a relationship between the worst performing bonds and weak ESG scores, albeit with the caveat that this is a small sample size.
Ranking the index by ESG scores, the 30 bonds with the highest ESG ratings delivered a 6.5% weighted average total return. Conversely, the 30 bonds with the lowest ESG scores returned 3.6% on the same basis. By way of comparison, the index returned 4.9%, implying that an ESG filter applied to a portfolio of European high yield bonds would have enabled an investor to significantly outperform the index in 2017.
The US index displayed a similar pattern to the European index, with the worst returning bonds exhibiting a low average ESG score.
From this analysis, it appears that high yield bond ESG scores and total returns are not strongly correlated. However, this could be due to the nature of high yield return distributions last year. Most bond returns were clustered around a very tight range, in a relatively low volatility environment, with a fat tail made up of some big negative returns (or in other words, the asymmetry of returns in a tight spread environment demonstrated a leptokurtic bias). This suggests that traditional correlation analysis may not give us any meaningful insights.
Nevertheless, it is noticeable that an ESG filter appears to have some predictive power to avoid underperformers. In this way, ESG analysis can help investors avoid some of the idiosyncratic risk that exists in the high yield corporate bond market.
Subordinated debt enjoyed an excellent year in 2017, AT1 (Additional Tier 1) bonds in particular. But what are the unique features of this sub-asset class and do AT1 bonds still offer value? M&G credit analyst Mark Robinson, who focuses on the banking sector, joined me this morning to explain the challenges that today’s tight spread levels potentially hold for investors.


Sign up to the Bond Vigilantes mailing list to ensure you never miss a great article from our expert Bloggers. We will email all new articles to your inbox, meaning you can stay on top of the world of Bonds.
I confirm that I would like to receive information about Bond Vigilantes and products and services from M&G Securities Limited.
We will use the email address and personal data you have shared with us to send you this information. For existing customers, submitting your contact details and requesting to receive this information from us, will replace any earlier choices you have made in respect of marketing information.
You can unsubscribe from marketing at any time, at which point we will not send any further marketing information to you, by selecting the unsubscribe link in all communications.


