


Carillion case study: All was not what it seemed
In its 2016 Annual Report entitled ‘making tomorrow a better place’, Carillion claimed they had ‘a good platform from which to develop the business in 2017’. Less than ten months after publication, Carillion went into compulsory liquidation, bypassing administration and the chance to continue trading. Assets will be realised and distributed to creditors, leaving little or no value remaining. But could this have been foreseen?
Carillion describe themselves as a leading integrated support service company with extensive portfolio of Public Private Partnership and construction contracts. At the time of the preliminary 2016 results release, Carillion reported cash conversion of 117% and net debt/ EBITDA (Earnings before interest tax depreciation and amortisation – a measure of cash flow) of 0.8x. These measures alone might have suggested an investment grade credit profile, with a relatively low probability of default, but delving deeper reveals a different story.
- Cash conversion
Carillion defined cash conversion as underlying cash inflow from operations divided by underlying profit from operations. The former includes movements in working capital, used to fund day-to-day operations. Whilst net movement in working capital did not flag anything unusual, it was clear that the deterioration in receivables during the year (£339m movement) was largely being funded by increasing payables (£342m movement), leading to stretched working capital.
Exacerbating the situation, Carillion introduced a reverse factoring Early Payment Facility (EPF – a form of supply chain finance) in 2013 allowing them to extend (almost doubling) payment terms to suppliers up to 120 days. As part of the facility, Carillion’s banks would pay suppliers first before recovering from Carillion thereafter, effectively creating a debt-like short term creditor in the balance sheet.
Whilst the use of reverse factoring facilities by contractors is not unusual, the EPF was optically improving reported cashflow without increasing debt, when in practice it was effectively doing the opposite. Furthermore, cash conversion as reported by Carillion was a poor indicator of the cash situation of the business. A better measure to analyse was absolute free cash flow; taking into account cash spent on capital expenditure, interest, tax, pension contributions, dividends and acquisitions. This would have revealed Carillion were burning through cash in two of the last four years 2013-2016.
The extent to which the EPF was a symptom of Carillion’s malaise or a cause can be debated, however, as the EPF would be invalid should supplier or Carillion become insolvent, it was certainly entwined in the ultimate collapse. Ironically, the two sole references to the EPF in the Annual Report mentioned only the ‘positive’ impact the facility had on suppliers.
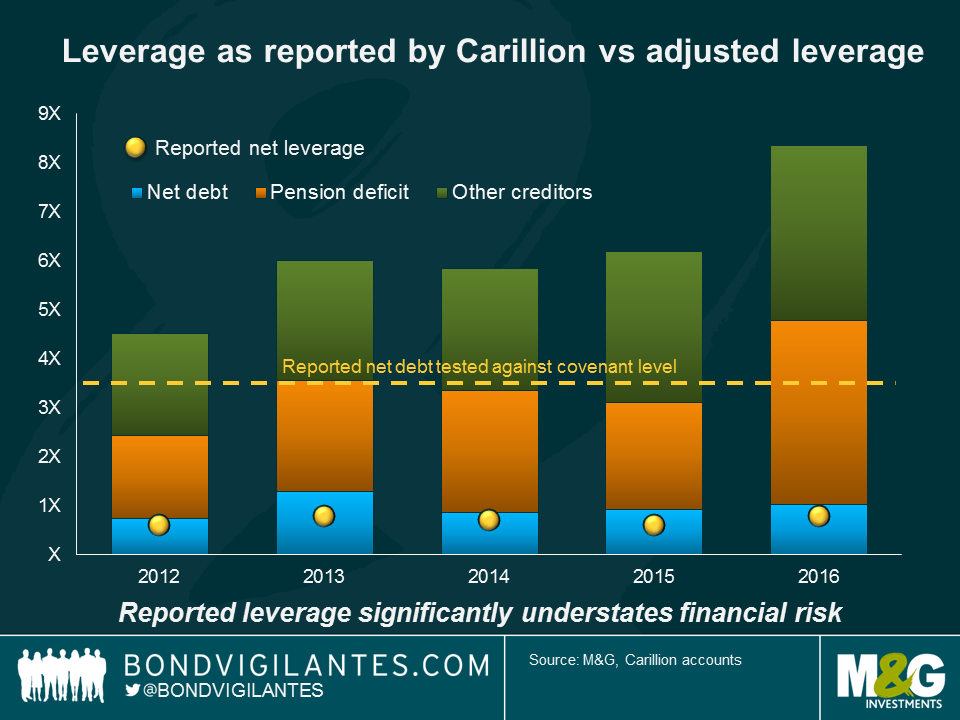
- Net Leverage
At face value, net leverage appeared low in the 2016 report, comfortably inside banking covenants set at 3.5x. A truer picture of Carillion’s liabilities, however, should arguably have included the other creditors created by the EPF, and the pension deficit, which itself had more than doubled during the course of 2016. Viewed in this way, the deterioration of the balance sheet is more readily apparent.
The dust is still settling on the company failure, as stakeholders, including the government, grapple with what went wrong and how it could have been averted. A complex combination of factors played a role, beside the cash and leverage features mentioned, including contract accounting, thin profitability margins, generous dividend pay-outs to shareholders, and intangibles on balance sheet which dwarfed equity leaving them vulnerable to write-downs. The lesson for investors, meanwhile, is that reported numbers rarely reveal the whole picture. Investors need to get into the details of the financials to better understand the true economics of a business.
The value of investments will fluctuate, which will cause prices to fall as well as rise and you may not get back the original amount you invested. Past performance is not a guide to future performance.
19 years of comment
Discover historical blogs from our extensive archive with our Blast from the past feature. View the most popular blogs posted this month - 5, 10 or 15 years ago!


Bond Vigilantes
Get Bond Vigilantes updates straight to your inbox