
Rolldown
A dispatch from the number crunchers – Yield curve rolldown
By Matthew Russell
15 April 2026

After a stellar 2017, eurozone economic data releases have disappointed recently. Stefan Isaacs joined me this morning to discuss the region’s prospects, focusing on the key learnings from the latest ECB meeting, why the US Treasury sell-off has so far failed to have a material impact on European rates, and implications for credit markets.
The flattening of the yield curve is carefully watched by investors as it is traditionally a good indicator of an economic slowdown. However, we always need to question conventional wisdom, and one thing we can say about the great financial crisis, and the great financial recovery, is that the actions central banks have taken to meet their mandates has been quite different this time.
The Fed has led the central bank policy response to the crisis, cutting rates aggressively, employing quantitative easing (QE), and Operation Twist – the process whereby the Fed simultaneously sold short-dated bonds and bought long-dated bonds to help drive down borrowing costs and boost economic growth. These policies have worked – unemployment has fallen to low levels, and capacity constraints have or are near to being reached. In this type of environment, monetary accommodation – both conventional and unconventional – needs to be removed.
The central banks firstly decided to reverse conventional monetary policy easing, increasing short-term interest rates back to a more “normal” level after being held close to zero since the onset of the financial crisis. The Fed has made good progress towards this level. When this conventional rate approaches the desired level, policy should finally shift to focusing on reversing the unconventional measures they have taken. The Fed has therefore relied on a series of gradual rate hikes to take some of the heat out of the economy – the resulting increase in short-term interest rates has led to a flattening of the yield curve.
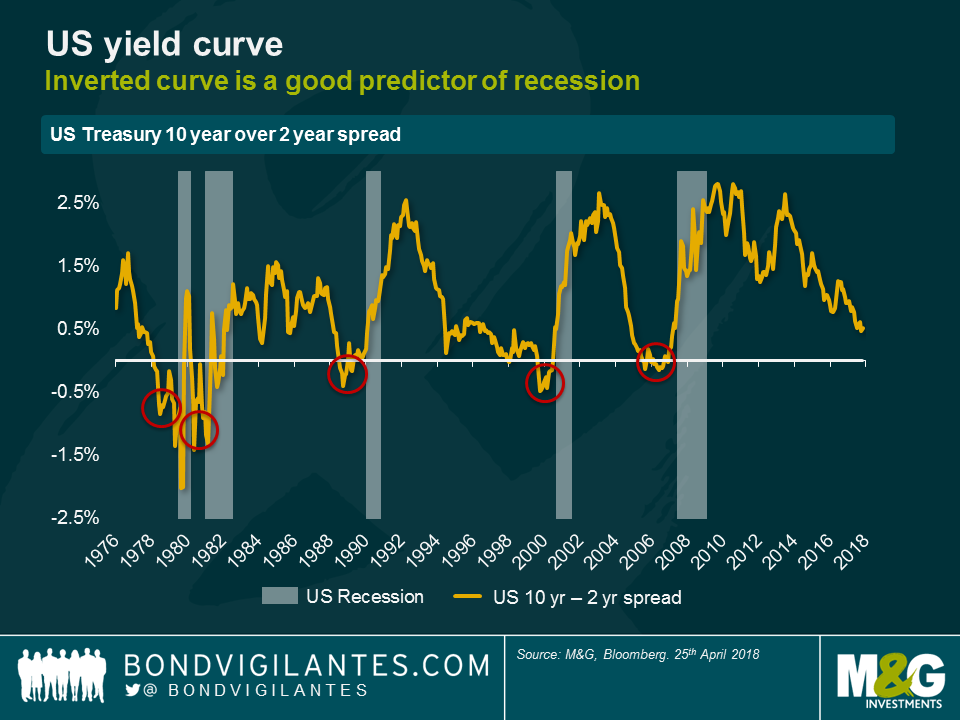
In normal economic cycles this flattening implies a higher probability of the yield curve inverting, something that has historically had significant implications. The Fed has pushed rates up regularly and transparently in the first step of normalisation, accompanied by only a minor reduction in the balance sheet. Further reductions of the Fed’s balance sheet holdings are also hard wired into its monetary programme as existing Treasuries mature. However, one thing the Fed has not done is unwind the distortion they caused to the yield curve through Operation Twist.
I think that the next phase of policy will involve less reliance on interest rate hikes. It will feature a more aggressive unwinding of QE, and a reversal of Operation Twist. This unwind can be completed by reorganising the balance sheet of the Fed through buying of shorter dated securities and selling longer dated securities. This would have the benefit of removing duration risk from the Fed’s balance sheet, and would steepen the yield curve.
The market is very concerned about the flatness of the curve and its implications, and the Fed itself is also concerned considering the historical predictive nature of the curve. One presumes the Fed wants to tighten policy, maintain growth, remove the unconventional policy stimulus it has undertaken, and reduce the risk on its balance sheet. By buying short dated assets and selling long dated assets, the Fed will help achieve its policy goals, and re-steepen the curve. This should result in a lower need for short rates to be hiked to counteract the residual unconventional policy operations that hang over the market.
Operation Twist was first deployed by the Fed to distort the yield curve in the early 60s. This time let’s hope for Operation “Perfect”, and the Fed hitting its key objectives for monetary policy of maximising employment, stable prices, and moderate long-term interest rates. I think they can do it.
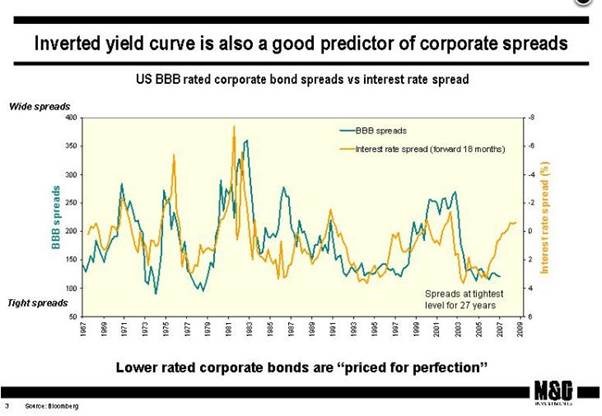
Jim recently updated an old chart from 2007 showing the relationship between a flattening yield curve and credit spread levels. Back then, this classic leading indicator of recessions correctly predicted a big sell-off in corporate bonds. The rest, as they say, is history.
More than 10 years later, Jim joined me this morning on BVTV to discuss if recent US flattening means we really could be heading for the next big credit sell-off, or whether there are still enough factors to support credit. Watch as we debate the similarities and differences between 2007/8 and today.
As the U.S. yield curve flattened to just 45 bps (2s-10s) last week, we dug out something I wrote back in 2007, in the early days of this blog. A chart that accompanied the blog showed that a) U.S. BBB credit spreads had hit their tightest level for nearly 3 decades and b) that the yield curve had flattened substantially (and in fact inverted). If you pushed the yield curve shape chart 18 months into the future it seemed to have a remarkable predictive power for what credit spreads would do next (not entirely surprisingly, as a flatter yield curve is traditionally a good indicator of economic slowdown). Thus, in 2007 it appeared to predict a big selloff in corporate bonds. Of course, all that happened, and more – credit spreads jumped to levels far higher than the 200 bps implied by the curve, as the Great Financial Crisis hit. But the directional call was sound.
By popular demand. we’ve just updated the slide for the period since the Great Financial Crisis. As in the earlier chart we have extremely tight credit spreads (at similar levels to those seen in 2007), and like then the yield curve is very flat, although not in inverted, recession predicting territory.
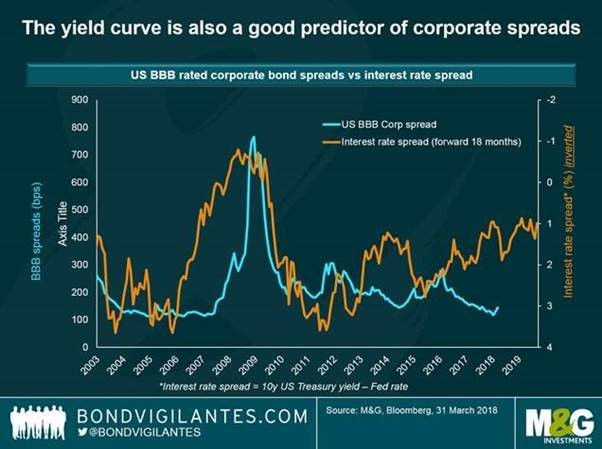
Similar to 2007, there is a gap between the continued strong performance of BBB credit spreads, and the shape of the U.S. yield curve. Looking at the most recent data you would think that there is a good chance that credit underperforms from here. However, eyeballing the chart it’s also clear that the directional relationship between the two series is nowhere near as strong as it was pre-GFC. Look at the period 2012 to 2015 for example: the yield curve flattened substantially from +375 bps to just over +100 bps. Yet BBB credit spreads tightened aggressively over the same period. Of course, the post GFC world is also a world where quantitative easing from central banks drove an aggressive search for yield from investors, which not only reduced credit spreads, but consequently allowed corporates to borrow at lower rates of interest. Thus, default rates plummeted and the credit cycle has been incredibly elongated. Perhaps though the tailwind for this cycle is ending as quantitative easing tapers away, and central banks raise rates. The flattening yield curve must at least be a warning that credit valuations are now stretched.
Whilst I’m blogging again (I took most of the year to date off, having a social media break) I’d like to pay tribute to my friend and old Bank of England boss Hamish Watson, who died recently. Hamish gave me the chance to move out of the world of financial statistics (remember M4?) at the Bank and taught me everything I know about bond maths on the Bank’s gilt desk which he ran. He subsequently was one of the first staff members at the new Debt Management Office set up after Gordon Brown made the Bank independent in 1997. Hamish was a massive sports fan, and saw his beloved Aberdeen FC lift the Cup Winners’ Cup in Gothenburg in 1983. He was also Eddie George’s bridge partner (rather him than me – I trembled when the Governor even entered the room in his cloud of smoke). I doubt anybody knew more about gilts than Hamish did, and he was a genuine expert in his field, saving the taxpayer money by getting us a good price for ever increasing bond issuance. We’d meet for beers after he retired in the Blue Anchor by Hammersmith Bridge. He’ll be missed.

It is fair to say that markets have become more lively of late. One sector in particular has been the epicentre of revived market volatility – Technology.
In the US high yield market, the US tech sector has weakened relative to the broader US high yield market. Given higher leveraged balance sheets, high yield bonds tend to be more sensitive to sector specific headwinds.
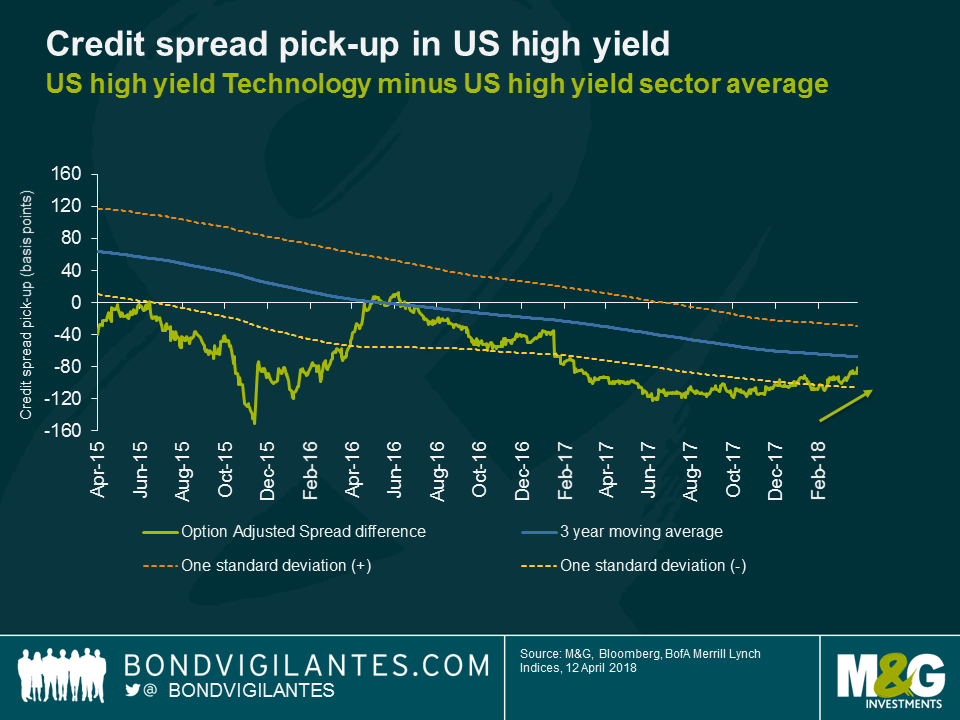
The chart below shows the spread pick-up for owning the US HY technology sector versus the broader US HY market. Whilst still negative, the credit spread differential has turned less negative, moving from -115bps at the start of December to -81bps. To draw parallels to the equity tech sell-off which was tied to privacy concerns, would be a hasty conclusion. The high yield tech sector had a lot of idiosyncratic stories going on ranging from strategic reviews (Dell), M&A talks (NXP), weaker than expected results (Veritas) to rating downgrades (Lexmark), to mention a few. Despite the recent weakness, US Technology spreads in high yield continue to trade tight relative to the US high yield market over a 3-year period.
While an escalation of the trade dispute remains a tail risk, China remains an important market for many technology multinationals. This is from both a product components and source of revenue perspective (for example, 30% of Apple’s revenues come from China). Therefore, it would not be a wild assumption to think that credit spreads of investment grade technology issuers would have underperformed the wider investment grade corporate bond market of late.
In reality, the contrary is the case. The US IG technology sector has outperformed during this most recent bout of volatility versus the US IG index, moving from one standard deviation cheap (based on historic spread levels) at the start of 2018 towards the 3-year moving average.
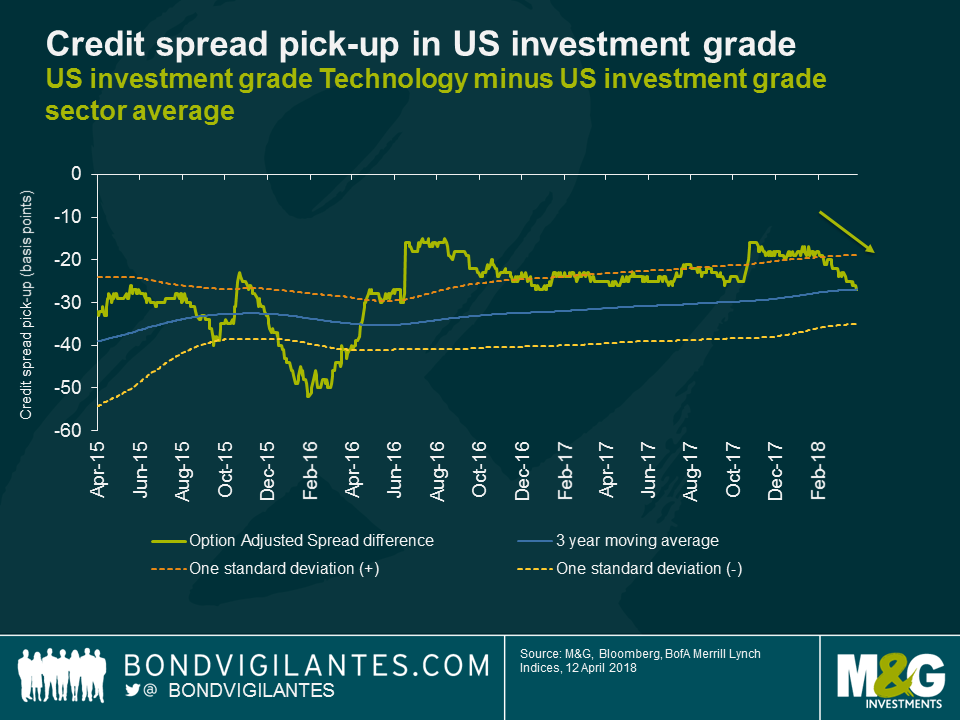
The surprising price action in the US IG technology sector can be explained by looking at the major issuers of corporate bonds. The technology sector is dominated by Apple, Microsoft and Oracle, three major bond issuers with approximately USD 250bn of debt outstanding, accounting for 41% of the technology index. These companies are highly rated names with large cash balances to service their debt. As a result, these high quality names have managed to remain resilient in the face of rising risk aversion which has impacted the wider credit market.
While ample liquidity positions provide comfort to investors over the short to medium term, long term implications are harder to grasp. On the one hand, the sector faces more challenges from stricter data regulations, online taxation reforms and tariffs – with the impact of each hard to quantify for now. On the other hand, Trump’s tax law changes, put into place last December, should give credit investors comfort as higher free cash flow positions can be used to reduce debt piles if required.
As always, a company’s individual credit profile needs to be analysed to assess if such long-term risks are appropriately reflected in the credit spread. While equity markets have responded sharply and reassessed the growth potential of technology companies, credit markets don’t seem to be too worried.
On this week’s BVTV I am joined in the studio by fund manager Dr Wolfgang Bauer and we will be focusing on the recent escalation in geopolitical tensions after the US imposed further tough sanctions against Russia. What does all this mean for bond investors and should we be now thinking about de-risking our portfolios? As ever, the picture is more nuanced than it would first appear. While Russian bonds and the ruble saw an inevitable tumble, credit markets in general have held up remarkably well over the past few days. Broader economic fundamentals also remain encouraging, with latest US inflation figures and Fed minutes suggesting a steadily improving economic backdrop.
The current Conservative Government has pledged to meet its 2015 manifesto commitment to deliver one million homes by the end of 2020 and to “deliver half a million more by the end of 2022“. For this to be met, completions would need to rise to levels not seen since the late 1970s.
Unfortunately for the UK Government, increasing the housing supply has long been a difficult challenge. There has been some recent success with the number of new dwellings completed in 2016-17 reaching 178k, almost equal to the 2008-09 number. However, this is still well short of the pre-crisis peak in 2007-08 of 215k and the longer-term peak of 378k. Unfortunately, private enterprises are unlikely to increase the number of home completions from the 145k built last year due to the uncertainty surrounding Brexit and dwelling completions are likely to fall from current levels. In addition, Local Authorities have long since stepped away from housing development. The budget constraints now faced by Local Authorities gives little confidence that they will return to the market in a meaningful way any time soon.
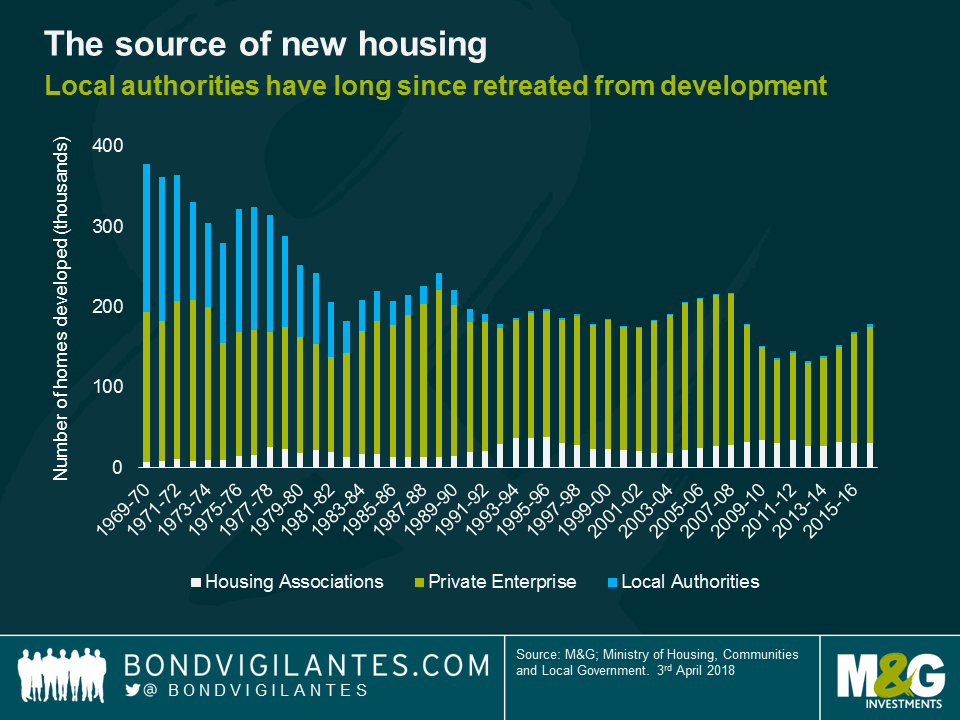
Therefore, if the Government is to get anywhere near meeting its target, the most likely source of additional development will be from the Housing Association sector.
Housing Associations are mostly not-for-profit, charitable organisations which provide a mixture of housing types, predominantly social housing. These social units are let at sub-market rents and are in high demand across the country, particularly in the South East of the UK. A large proportion of the rent comes from housing benefit received by the tenant. This provides a significant source of very stable income and is one of the reasons housing associations can approach the property market in a different way to private enterprises and can take a longer-term view on market value.
This is evidenced in the below chart which shows that during periods of slow or negative economic growth in the UK, Housing Associations complete a greater proportion of total dwellings constructed.

Housing Associations are able take a longer-term view on the housing market compared to a property developer because they are not as impacted by market movements. Whilst they do develop properties for market sale, these are small in scale and could be converted to social housing, given the high demand, to provide a source of income until the market recovers.
In my opinion, the current target is totally unrealistic for the Government to hit. Not only will funding need to increase further, but a solution to the serious skills shortage is needed. As reported in their latest market update, the Chief Executive of the Federation of Master Builders said “The number of respondents reporting difficulties in hiring key skills, such as bricklayers and carpenters, has never been so high.” A serious problem particularly when considered alongside the issues with the large construction companies such as Carillion. The Government has a difficult job in solving all these problems and will inevitably not solve them all, however any progress it can make will be beneficial to all, not just investors.
Housing Associations source capital from markets in order to fund development projects, using a combination of debt and government grant. Capital markets have been an excellent source of cheap long dated funding, currently inside 150 basis points relative to gilts for the larger issuers, and the Government has pledged a further £2bn in grants. The question is whether this is enough to meet the Government’s medium-term goal. Investing in the sector is not without its challenges, including short term risks of exposure to an uncertain property market and indirect linkage to a potentially weakening sovereign, and the need for a long term view because of the tenors (usually 30 years) of the debt. However, for investors who are comfortable with these challenges, there is good value when compared to similarly rated corporate bonds.
Bouts of market volatility have characterised the year so far as investors try to correctly price in news coming from the US. Is investor reaction truly reflecting the fundamental picture? Christophe Machu, investment specialist in the Multi Asset team, takes a look.


Sign up to the Bond Vigilantes mailing list to ensure you never miss a great article from our expert Bloggers. We will email all new articles to your inbox, meaning you can stay on top of the world of Bonds.
I confirm that I would like to receive information about Bond Vigilantes and products and services from M&G Securities Limited.
We will use the email address and personal data you have shared with us to send you this information. For existing customers, submitting your contact details and requesting to receive this information from us, will replace any earlier choices you have made in respect of marketing information.
You can unsubscribe from marketing at any time, at which point we will not send any further marketing information to you, by selecting the unsubscribe link in all communications.


