Markets
Gold prices: beyond inflation and real yields
By Robert Burrows
25 April 2024

Spanish government bonds have outperformed their European peers so far this year. How has the country changed from being near a European Union bail-out only a few years ago to its present, more solid state? Watch M&G Investment Director Ana Gil explain it.
The bond sell-off that started last week with the publication of strong US data continued over the past five trading days, even if Friday’s job report came in below expectations and a slew of global data and events only confirmed a worsening momentum: the International Monetary Fund (IMF) cut this year’s world economic growth forecast to 3.7%, down from 3.9%, citing challenges to trade; Italian 10-year bond yields spiked to 3.5% as the government’s turf war with Brussels over the country’s budget intensified; Germany’s industrial output was much weaker than expected (more below); South Africa replaced its finance minister after corruption scandals, and Japan’s Tankan manufacturing report posted a third straight quarterly drop. The backdrop seemed to depress everybody as both bond and equity markets fell. In fixed income, only 9 of the 100 asset classes tracked by Panoramic Weekly posted positive gains.
The week’s few performers were led by Brazil, whose sovereign and corporate bonds rallied after far-right candidate Jair Bolsonaro won Sunday’s general election first round, facing Workers Party leader Fernando Haddad in a second and final round on Oct. 28. The real surged 5% against a rising US dollar as both candidates are seen as fiscally responsible and somewhat market-friendly. US leveraged loans, which typically bear a floating rate, also posted positive gains as they may profit from the higher rate environment. Traditional safe-haven currencies, such as the dollar and the yen, also rose. The Chinese renminbi continued this year’s downwards slope, trading at 6.92 units per dollar, far from the 6.26 level seen in April. The country cut the reserve ratio requirement for some banks as it aims to avert a slowdown at the same time that it tries to rein in leverage. Oil cooled from its recent ascent.
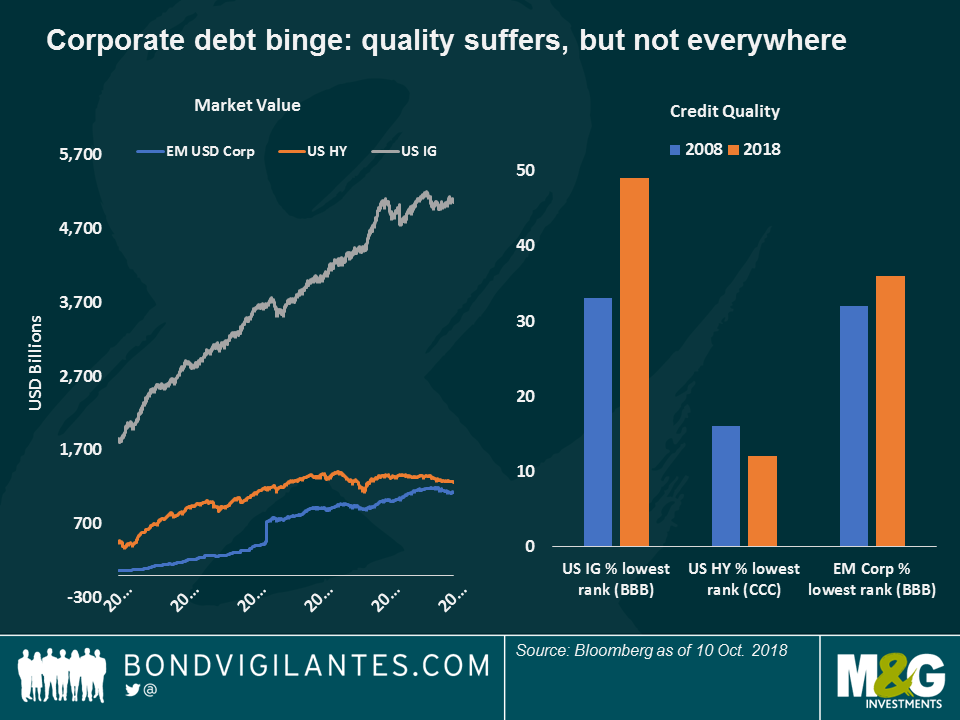
Corporate spree – time for the bill? Companies around the world have used a decade of cheap money to load up debt, not only to make investments but also to increase dividends and share buy-backs. The bill, though, may be coming soon: as rates increase, companies will find it more expensive to roll over their debt, something which could hinder profitability and damage credit quality. As seen on the chart, quality has already worsened, especially in the asset classes that have grown the most: US Investment Grade (IG), for instance, has more than doubled from $1.8 trillion to $5 tn over the past ten years – at the same time that companies bearing the lowest IG credit rank now account for almost half of the asset class, compared with a third in 2008. US High Yield (HY), instead, has also grown 2.7 times over the ten years, but has seen its lowest credit bucket fall to 12% of the total, down from 16%. USD-denominated Emerging Market (EM) corporate debt, which has ballooned to $1.1 tn (it started at $63 bn one decade ago), has also seen its lowest rating bucket increase, but more moderately. No surprise then that US HY has outperformed its rivals so far this year: the asset class has gained 1.9%, while US IG has dropped 3.2%, and EM Corporates have lost 1.9%. Fundamentals matter.
Brazil’s assets – jogo bonito: Brazil’s currency and bonds rallied as 147 million voters chose two allegedly fiscally-responsible leaders to run in the election’s final round, with hope that they will bring the country’s recent miseries to an end: at 12.2%, the unemployment rate has doubled from 6% four years ago, while the government’s deficit has swollen to 7.4% of GDP, from c. 2% between 2010 and 2013. The optimism pushed the real higher to 3.7 units per dollar, the strongest level since August, and completely wiped out the summer losses triggered by the recent Argentinean and Turkish sell-off. Both left and right-wing candidates are expected to tone down their views towards the centre in order to seize more votes ahead of the Oct. 28 final round.
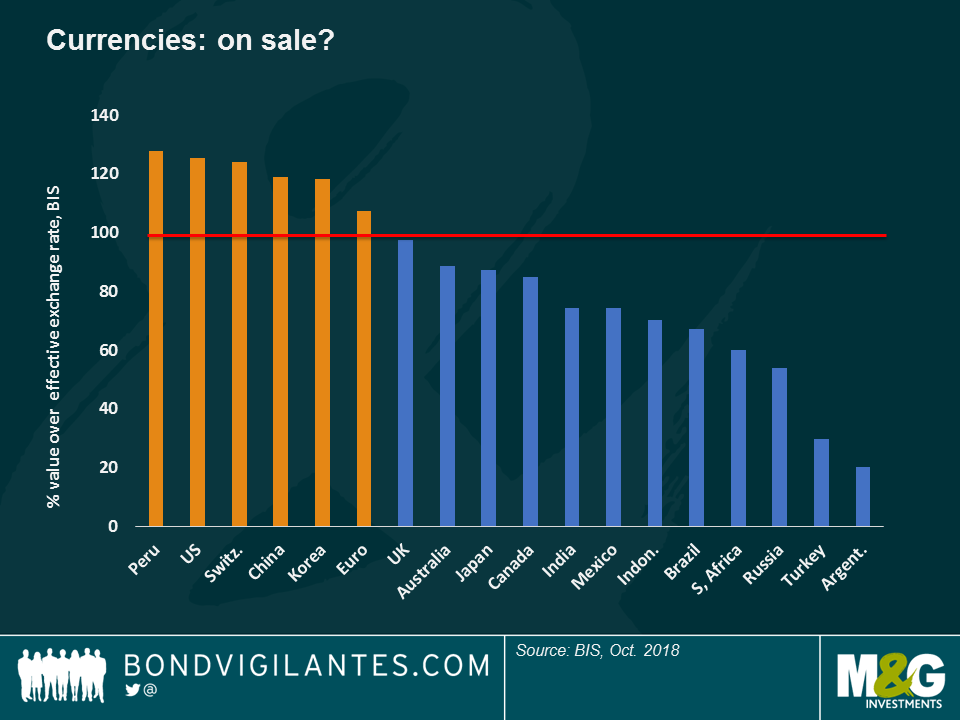
EM currencies – on sale? EM currencies have mostly plunged against the US dollar since early August, just before the deterioration in the Turkish and Argentinean economies led to a general EM sell-off. According to the Bank of International Settlements (BIS), known as the bank of central banks, recent moves have dragged down some EM currencies’ effective exchange rates, leading some investors, such as M&G’s Eric Lonergan, to believe that they now have some value – click here to watch Eric explain his views. Not all EM currencies have been affected, though: according to the BIS, the Peruvian sol is overvalued, perhaps given the country’s fundamentals: the economy is growing at a 2.3% annualised pace, while the Current Account deficit is at a moderate 1.4% of GDP. Inflation, at 1.3%, is also modest. A leading copper exporter like its neighbour Chile, Peru has posted eight consecutive months of investment growth. The sol, however, appears less sunny: it has dropped 2.8% against the dollar so far this year.
German industry – Oktober-rest? German industrial production fell 0.3% in August, well below expectations of a 0.3% increase and the third drop in a row. While export weakness is not showing on the country’s trade balance – as many had feared given the ongoing US-China trade wars -, Europe’s leading country is now becoming increasingly worried on another trade front: the Cologne-based IW economic institute warned this week that a no-deal Brexit could sink German exports to Britain by 57%.
Sovereign bond markets sold off last week, following strong US data. However, Friday’s US jobs report showed that hiring cooled down in September more than expected – a point that markets seemed to ignore as Treasuries continued to sell off. Is it a growing US economy that we have ahead? Or should we expect growth to be challenged by higher rates and rising oil prices? Watch M&G’s portfolio manager Eric Lonergan and macro specialist Stuart Canning discuss about it.
The long-end of the US Treasury market has often been described as a giant anaconda: it draws little attention as it sleeps most of the time, but the minute it wakes up, everybody around shakes. US 30-year bonds don’t bite, but their moves can be as poisonous as they basically determine millions of mortgage rates, as well as the price that governments and companies around the world pay for debt. Is this market about to spring higher in yield?
Until now, 30-year Treasury yields have generally made investors smile – a 600 bps rally over the past 30 years has made money relatively cheap, the term premium has collapsed, flattening the yield curve to levels not seen since the 2007-08 financial crisis, as seen on the chart below:
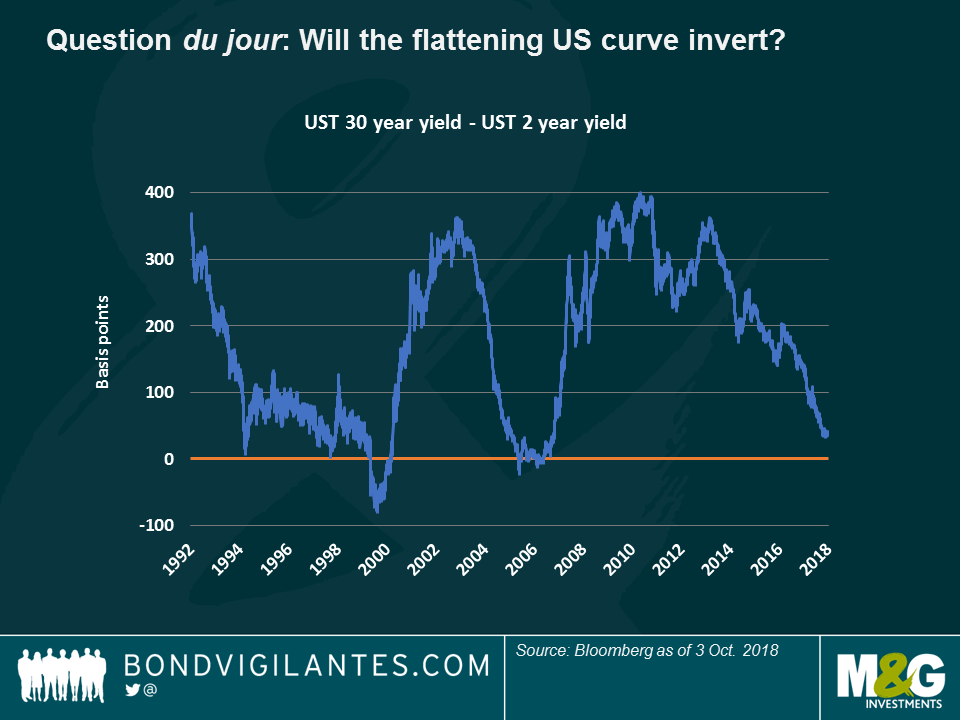
Investors are now watching this flattening with angst, fearing that it may signal a looming recession: when previous flattenings turned into an inversion in 2000 and 2006, a recession surely followed.
I don’t think this is the case now; more so, I believe we may see quite the opposite. This is because:
Technical reasons: 30-year Treasury yields could replicate what we saw in 10-year Treasuries earlier this year, and which I blogged about shortly before the market turned: after four years trying to surpass the 2.64% level, the 10-year yield finally breached through this level in February on the back of strong hourly wage data – finally a sign of inflation after a decade of dormant prices. This was a significant break of both the short and long term trends.
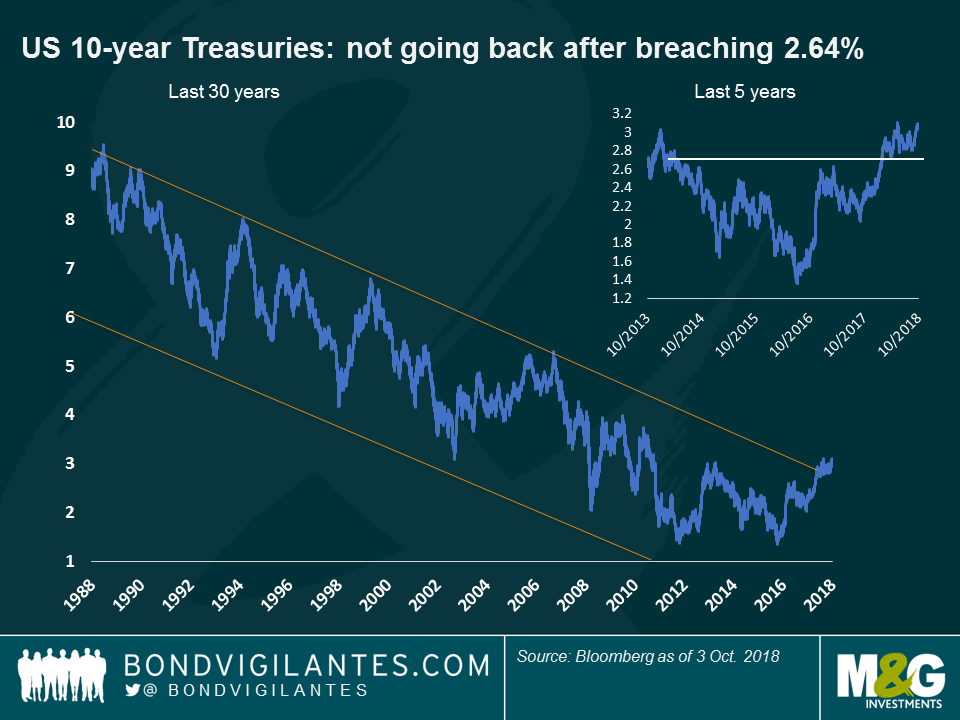
Could we be seeing a similar pattern in 30-year yields, which by nature are a bit slower to move than the more volatile 10-year market? As the chart below shows, 30-year Treasuries have also enjoyed a three decade-long bull run and have traded within a range between 2% to 3.25% over the past four years.

I believe this level could be breached soon: apart from an improving fundamental outlook (see below), the corporate tax changes from earlier this year encouraged underfunded pension funds to acquire long-dated fixed income securities by mid-September. Afterwards, demand for the asset class might drop, lifting yields.
Fundamental reasons: More lasting than potential triggers or technicalities, I believe long US rates may rise as a natural reflection of a robust economy. While not growing at a spectacular pace, the US economy is producing positive data, which may generate more inflation soon – generally a precursor of higher yields. Let’s see what the job market is telling us.
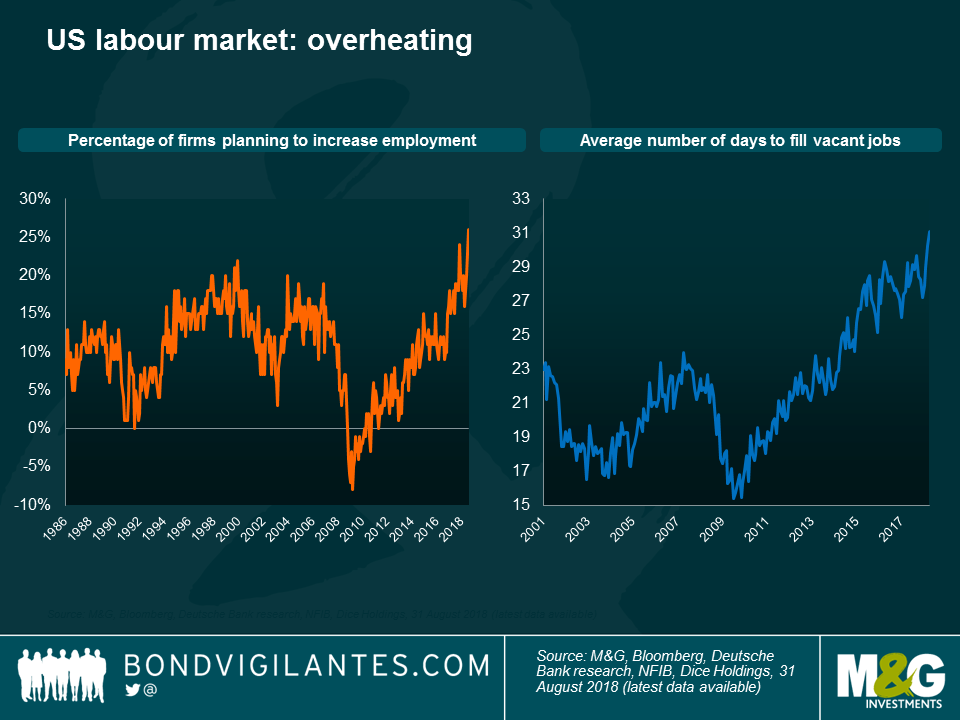
The chart shows that US companies have increased their hiring plans, at the same that it takes them more time to find talent. We all know that a tight job market generally feeds into inflation and ultimately, higher rates. Anecdotally, tech giant Amazon just announced a wage rise for its employees, a clear sign that the market is tight – if anyone knows the outlook for the economy and how tight the labour markets are, then Amazon should. Maybe Amazon provides another clue to the waking Anaconda of rising rates.
Global bond markets reacted sharply to Wednesday’s release of US Services data, which struck its best mark in 21 years: US 10-year yields spiked to 3.2%, the highest since 2011, while the dollar reversed a gloomy September to recover its August level. The usually less reactive 30-year Treasury yields surged, leading some investors such as M&G fund manager Richard Woolnough to argue that the market, often compared to a giant anaconda, might be turning – read his blog: US long rates: is the giant anaconda about to turn?
European sovereign bond yields also rose and equity markets rallied. The optimism was further underpinned by comments from Federal Reserve (Fed) chair Jerome Powell, who earlier this week said gradual hikes were appropriate for the US’s robust economy. While a rising dollar initially hurt Emerging Market (EMs) currencies and sovereign bonds, the asset class still posted five-day gains due to previous strong performance. Powell’s cautious approach to rate hikes helps cushion the potential negative effect of the Fed’s moves on EMs, which are still recovering from the Turkish and Argentinean crisis in August.
Almost three out of four of the 100 asset classes tracked by Panoramic Weekly posted gains over the past five trading days, with the losers mostly coming from Europe. Italy’s proposal that its budget deficit will reach 2.4% of GDP over the next three years was received with reluctance in Brussels, whose officials called the plan “out of line.” Italian woes hit other European assets and the euro, which sank 2% against the greenback over the past five trading days. The Mexican peso and the Canadian dollar gained almost 1% against a rising dollar after the US signed a new trading agreement with its two neighbours – one that doesn’t differ that much from the previous North American Free Trade Agreement. Oil surged.
Brazil – Bolsosamba: Brazilian sovereign bonds rallied 1.3% over the past five trading days and the real surged 5% against a rising dollar, the best-performing currency among a group of 16 majors. The real has now recovered about half of the lost ground since early August, when the Turkish and Argentinean crises hit other EMs. Investors are also anticipating a relatively market-friendly outcome in the general election, which is due to start this Sunday. After the vote, a final round on Oct. 28 will decide the winning candidate, with most odds now falling on far-right leader Jair Bolsonaro and Workers’ Party candidate Fernando Haddad. At present, markets see neither candidate as likely to adopt radical fiscal policies, hence the relief. As seen on the right-hand chart below, the real has strengthened as Bolsonaro has improved his poll-implied chances. To learn more about this week’s election, watch M&G Investment Specialists Pilar Arroyo and Robert Secker discuss.

Oil – supply matters: Oil prices rose to $75 per barrel, the highest since late 2014, when the commodity started a precipitous slide, dragged down by rising US shale production. The opposite dynamic seems now in play, as Iran’s exports drop due to US sanctions. The supply consequences of the geopolitical tensions have more than offset recent data showing rising US stockpiles: oil has surged 50% from the c.$50 per barrel level it had barely one year ago. The increase could dent next year’s economic growth, says M&G fund manager Jim Leaviss: Just like 2008? Oil up, ECB tightening – all we’re missing is a credit accident.
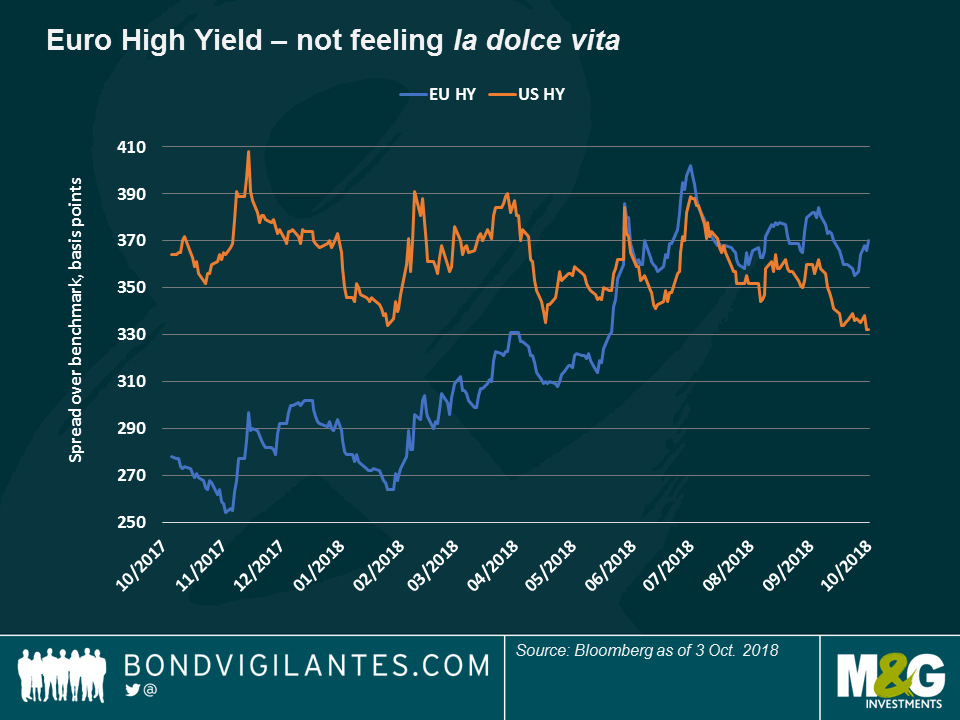
European High Yield – Catenaccio: The defensive football style that Italy is known for seems now to apply to the European High Yield (HY) market, whose index the country dominates. With a 14.7% weighing, the recent poor performance of Italian companies has dragged the index down and raised the premium that investors demand to hold the asset class over its US counterpart. After years trading below the US premium, European spreads overtook the US’s following the Italian election earlier this year. Since then, the asset class has suffered from the uncertainty surrounding the Italian budget, despite having an average higher credit quality than its US rival. European HY also has lower interest risk, with an average duration of 3.8 years, below the US’s 3.97. According to M&G fund manager James Tomlins, the underperformance of Europe’s HY index this year has been mostly concentrated on a list of specific names, including two Italian construction companies.
Swiss franc – less havenly: A traditional safe-haven in times of trouble, the Swiss currency failed to surge this week against the dollar while Italy and Brussels rowed over budget deficits. In fact, the franc has weakened 2.5% against the US currency over the past five trading days, mostly because the country is also having its own tensions with the EU, mainly over trade agreements including the access that EU investors might or might not have to Swiss equities. Swiss policy makers, however, may be pleased as they have complained repeatedly about the currency’s traditional strength.
As we pass the 10-year anniversary of the Lehman default and we started thinking about what we were doing back in 2008 (desperately moving my savings out of certain banks was high on the list for me, whilst listening to MGMT and Los Campesinos; album of the year? TV On The Radio’s Dear Science), I went back to our blog, to see what the early warning signs were in the summer of that year.
It is useful to have a record to be able to look back on a market moving event to see what was actually the concern at the time, rather than just remembering the post-event narrative. We had been worried about the state of the US housing market (here’s just one example of our doom and gloom coverage of US housing in Richard Woolnough’s blog in January of 2008: but during trips to the US in June that year it was something else that was grabbing the 24 hour news channels’ headlines: oil.
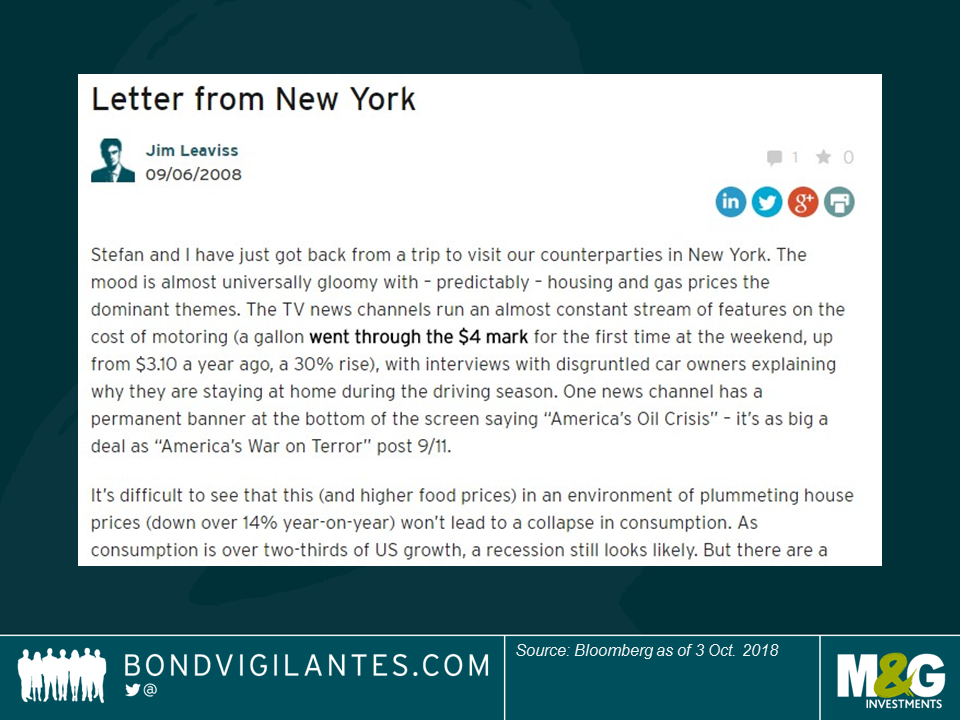
House prices still get a mention in the June blog, but oil was at the top of America’s worry-list. And rightly so, as a spike in the oil price preceded 11 out of the last 12 US recessions. Rising energy prices slow the economy dramatically; the impact might be lesser today, especially in developed markets where energy efficiency is much higher than it was in, say, the 1970s, but higher oil prices hit both consumers and businesses. Which brings us to today. In the past 12 months the price of WTI oil in the US has risen from around $50 per barrel to $75 per barrel, a 50% jump. Gasoline prices remain way below the $4 per gallon they reached in 2008, but are still elevated at nearly $3. Growth will be slower in 2019 as a result.

If you don’t believe that this 50% rise is going to slow the US economy, then you might have more sympathy with the view that emerging market countries, with currencies that have fallen sharply in 2018, are going to be more severely hit. The chart below shows that for Turkey, an oil importer, the cost of oil has more than doubled year to date. I’d expect the US to outperform the rest of the world in growth terms in 2019, albeit with both at a lower level thanks to this mini energy shock.

What else did I find in the “Summer of 2008” blogs? Well lots of talk about ECB tightening. The rise in energy prices had led to a headline CPI rate in the Eurozone of 4% in June 2008, double the central bank’s mandate. Short dated bunds were selling off as Jean-Claude Trichet stated that the ECB was on “heightened alert”. This is what we wrote at the time:
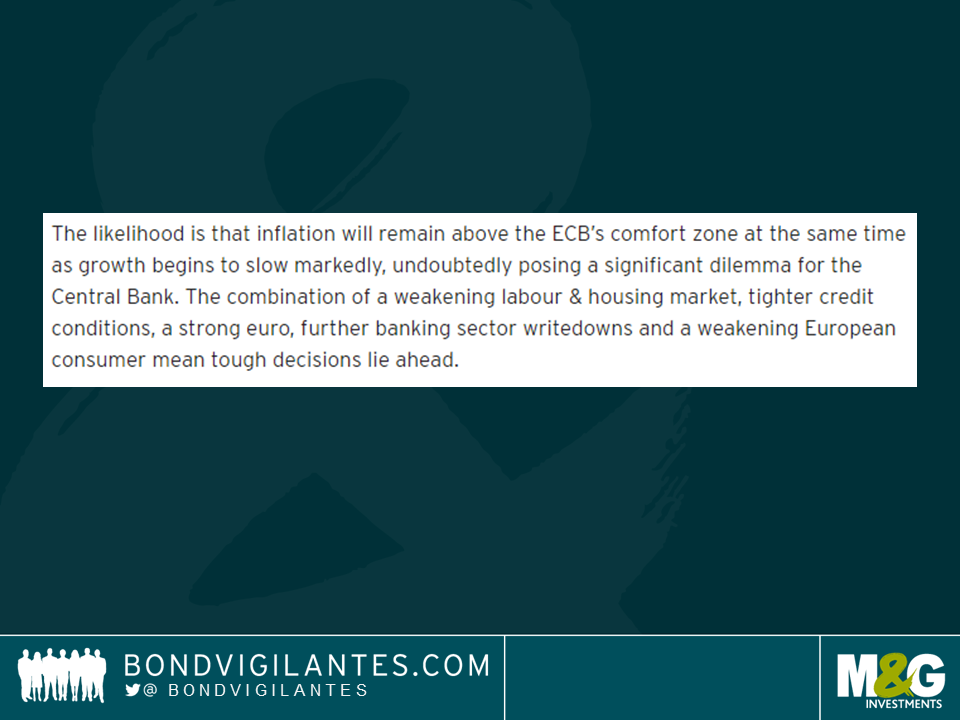
Trichet hiked rates by 25bps in July, despite the existence of a now defunct website http://www.stoptrichet.com/ collecting signatures to try to hold off rate rises. Rates at 4.25% would, of course, be the peak of that rate hiking cycle, and a year later rates would be at 1%.
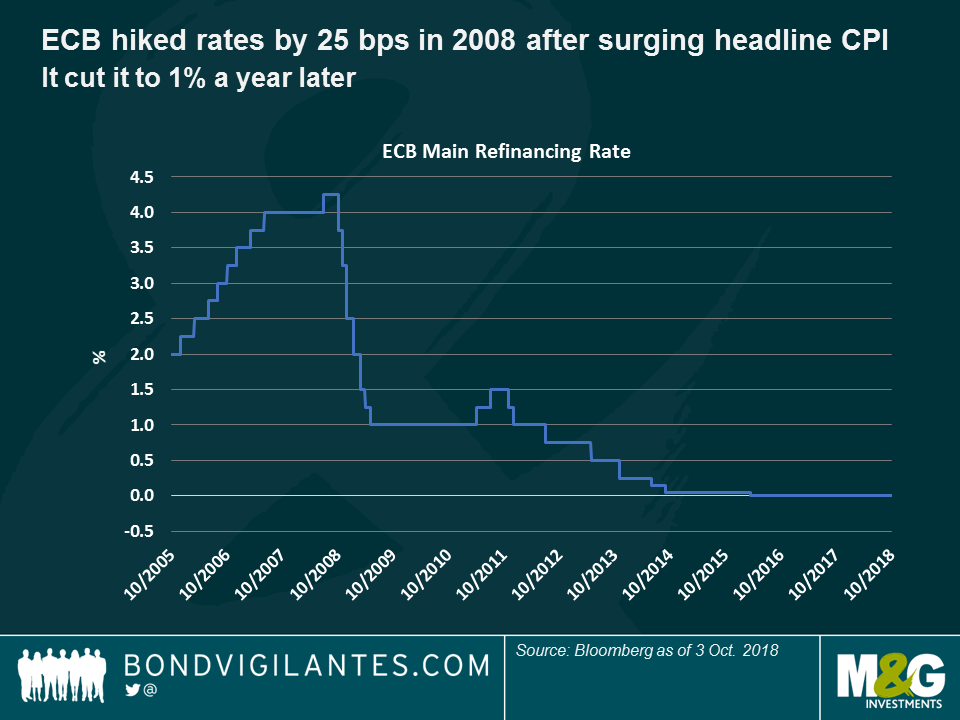
Today we have an echo. Whilst we are not seeing anything like the 4% inflation that the Eurozone experienced in 2008, the recent trend is firmer, especially in Germany which just printed CPI at 2.3% year on year. And we have a central bank that is tightening in this environment. On 1st October the ECB halved its Asset Purchase Program (APP) from €30 bn per month to €15 bn, and anticipates that the programme will finish in December “subject to incoming data”.
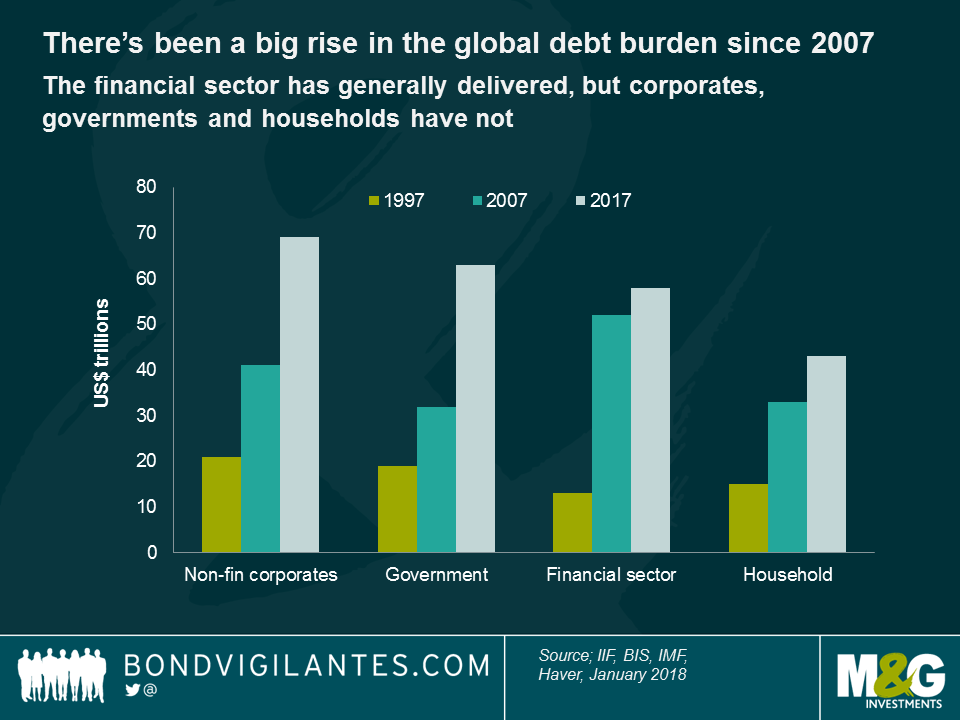
So, add monetary tightening from the European Central Bank (and of course from the Fed, Bank of England and many EM central banks) and a 50% rise in the oil price, and we have a scenario similar to the one we saw in the summer of 2008. But it IS different this time: we have substantially more debt in the global system than we did going into the last crisis. Gulp.
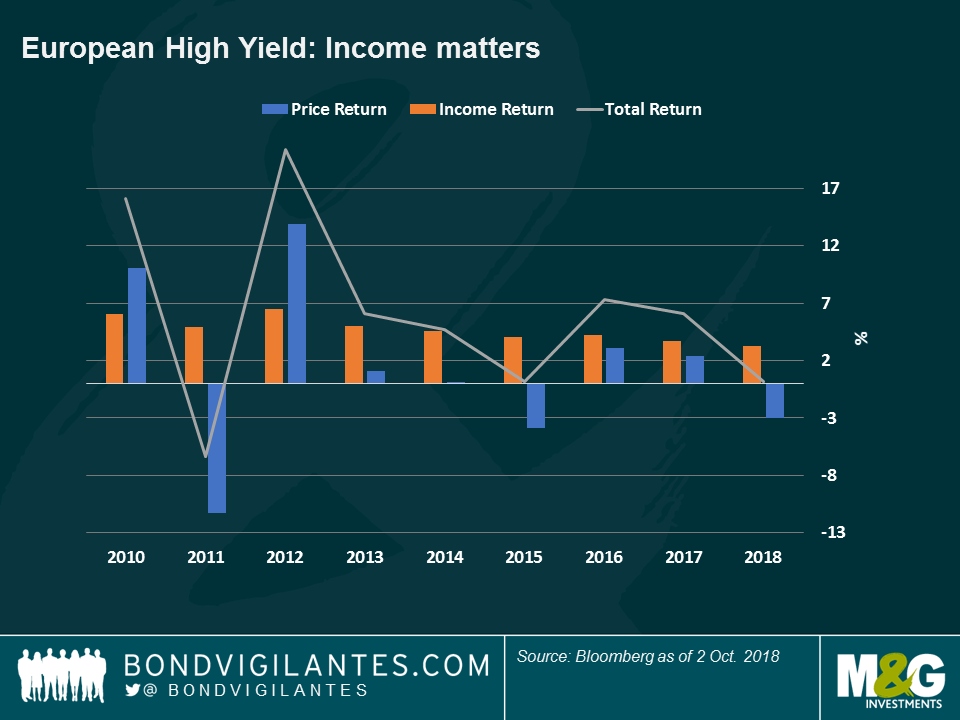
This has not been a vintage year for total returns in the European High Yield market: wider spreads have led to small capital losses, barely offset by a relatively low income of 3.2%, which has resulted in an anaemic total return of 0.22% year to date. Unexciting and dull? Yes, but only if one looks at the surface. The underlying trends are far more interesting – and relevant for investors.
Every year, the High Yield market tends to have some idiosyncratic outliers which experience severe price drops – this is par for the course and avoiding them is a manager’s skill – but it feels like the number of and severity of such moves has increased this year, as you can see in the chart below:
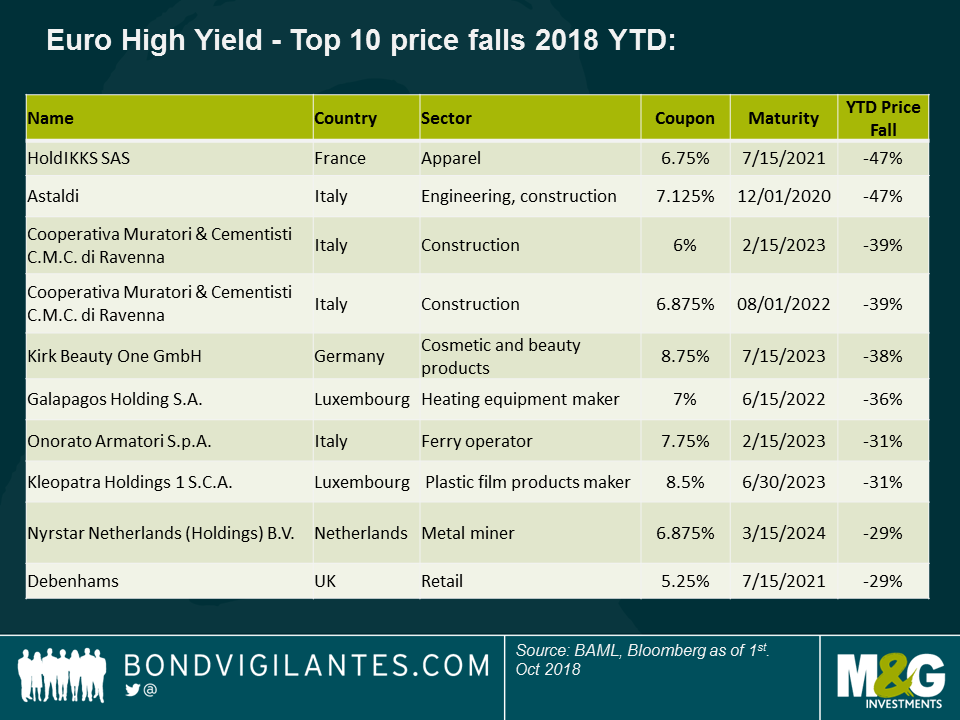
From the table, we see that the Retail and Construction sectors stand out. Starting with the first, the challenges that online shopping are giving retailers are well documented and very much still being felt: the bonds of UK department store chain Debenhams, German cosmetics retailer Douglas and French retailer IKKS have all continued to underperform as more and more shoppers prefer a mouse click than a trip to the store.
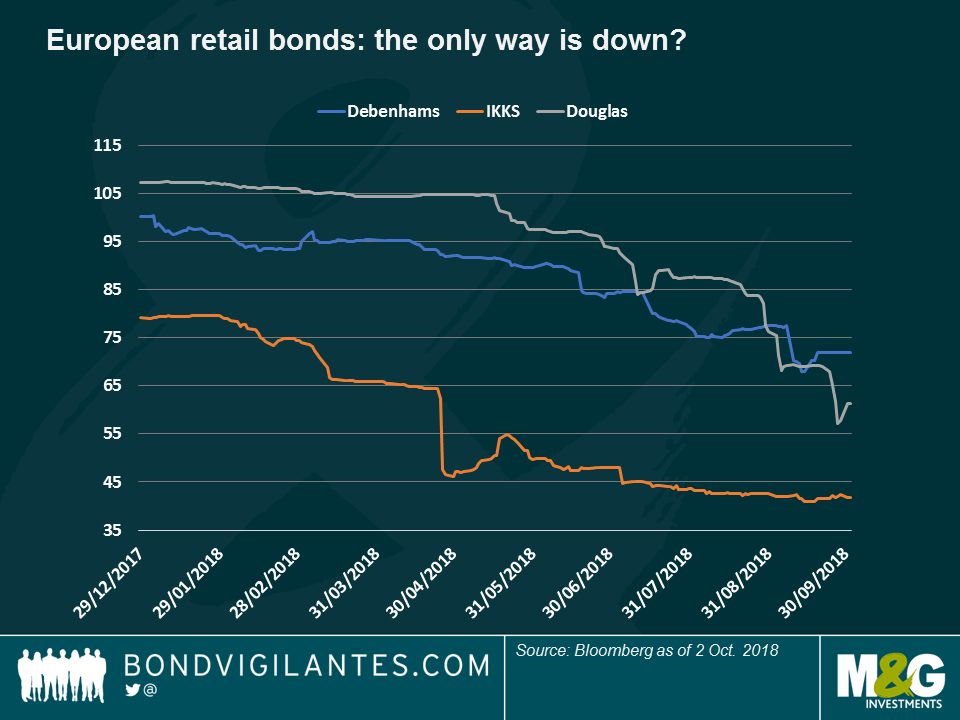
This, however, should not raise too many eyebrows as this negative sector trend has been well known for a while and the bond price drops have been more of a slow burn rather than a cliff edge-type decline, as the chart shows. Old habits die hard.
In contrast, the Construction sector has behaved differently: the speed and the severity of the drop in the bonds of Italian construction firms CMC Ravenna and Astaldi have occurred over a much tighter time scale, as seen below. These companies have suffered from poor results and in the case of Astaldi, a failed disposal and capital raise.
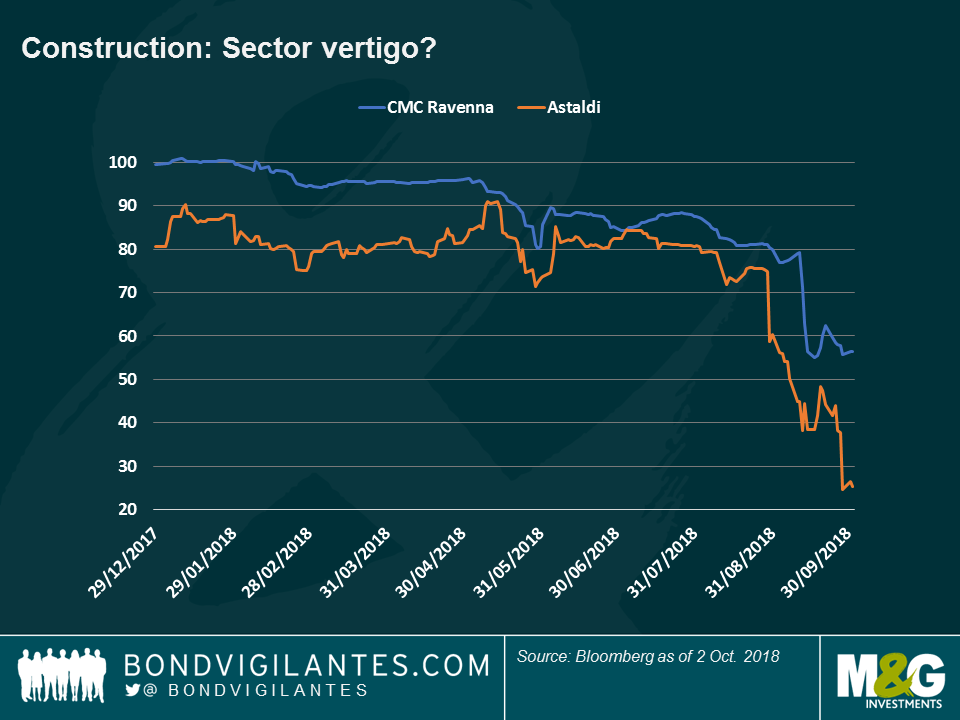
Here we can see the “cliff edge” in full force, and it suggests that the precipitous drop is more sudden, so maybe not due to long term fundamental challenges, which tend to brew over an extended period of time. What’s happening? Two thoughts spring to mind:
These situations are telling us that the present low yield, tight spread and slowing-growth European environment is making High Yield bonds behave differently to what we have seen in the past. Because of this, I think European High Yield investors should be even more cognisant of asymmetric risk to the downside than usual. Reaching for an extra 50 – 100 basis points of yield here and there can all too easily be wiped out by a sudden 25% fall in the price of one single holding. As ever, High Yield is a bottom-up market and thorough selection is paramount.
One candidate has been stabbed and a former potential one is in prison. It is not a movie but the run up to a general election in the world’s eighth largest economy, and one that can set the mode for Emerging Markets afterwards. What are the polls telling us and how could bond and stock markets react? Watch M&G Fixed Income and Equity investment specialists Pilar Arroyo and Robert Secker discuss potential outcomes.


Sign up to the Bond Vigilantes mailing list to ensure you never miss a great article from our expert Bloggers. We will email all new articles to your inbox, meaning you can stay on top of the world of Bonds.
I confirm that I would like to receive information about Bond Vigilantes and products and services from M&G Securities Limited.
We will use the email address and personal data you have shared with us to send you this information. For existing customers, submitting your contact details and requesting to receive this information from us, will replace any earlier choices you have made in respect of marketing information.
You can unsubscribe from marketing at any time, at which point we will not send any further marketing information to you, by selecting the unsubscribe link in all communications.