Markets
Gold prices: beyond inflation and real yields
By Robert Burrows
25 April 2024

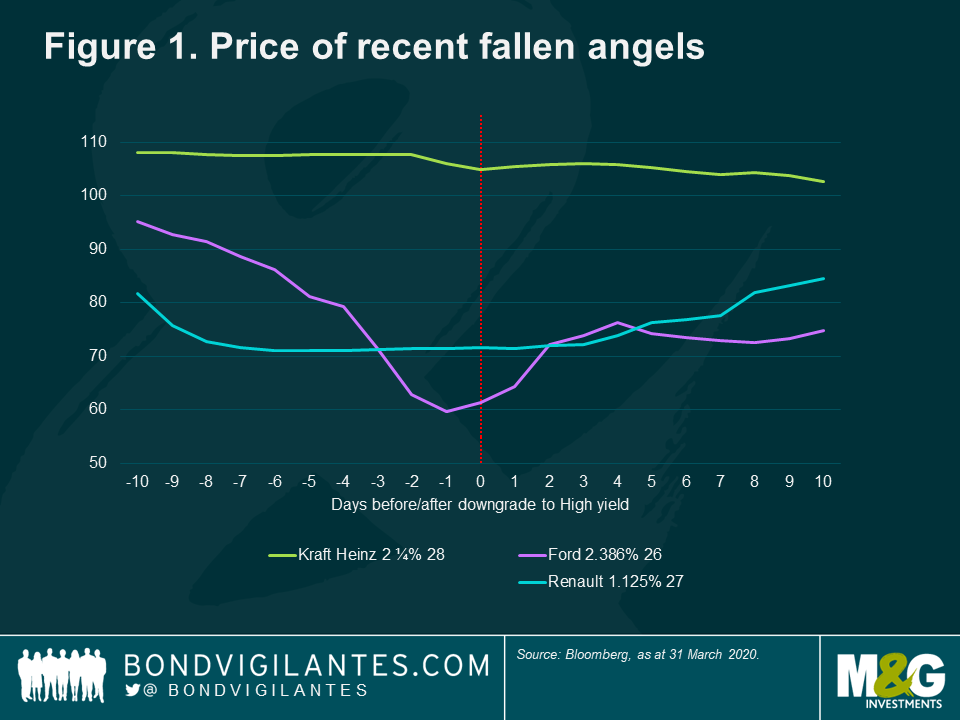
The coronavirus pandemic and low oil prices have led to a surge in ‘fallen angels’, companies downgraded from investment grade to sub-investment grade. Ford, Kraft Heinz, Renault and Marks & Spencer are amongst the issuers that have become fallen angels so far this year.
We often see price falls in such downgraded bonds. Investment grade (IG) and high yield (HY) are typically treated as separate silos in an investor’s portfolios, which can lead to significant turnover of bonds from IG portfolios to HY portfolios when an issuer is junked. Figure 1 below shows the price action of three recent fallen angels with Ford, which has the largest debt pile, falling the furthest. We can also see that the market often anticipates the rating action before the agencies act.
The relative size of the IG and HY markets, as shown in Figure 2 below, intensifies the price moves. BBBs now account for just under half of the euro IG market and is over four times the size of the European HY market. This isn’t a European phenomenon: US BBB accounts for 48% of the IG market, and the BBB market is over three times the size of the US HY market. This exacerbates the price movements as supply exceeds demand.
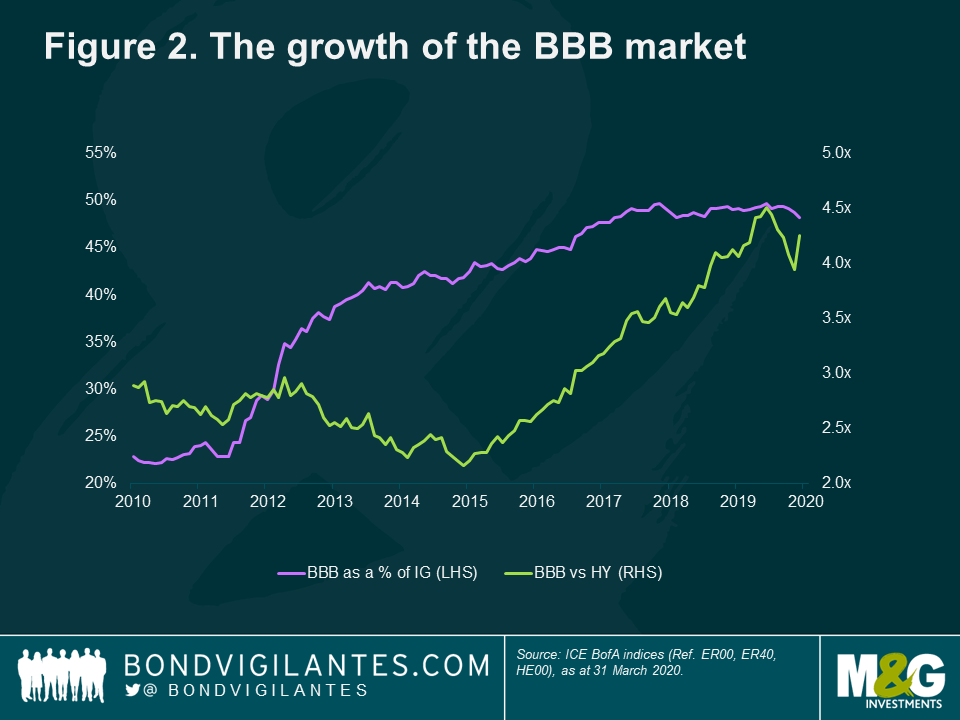
The growth of BBB rated debt has been well documented, but, until this crisis, most commentators were sanguine about the risk of heightened fallen angels (Figure 3 below). The rating agencies also seemed to give company managements the benefit of the doubt when they made debt-finance acquisitions.
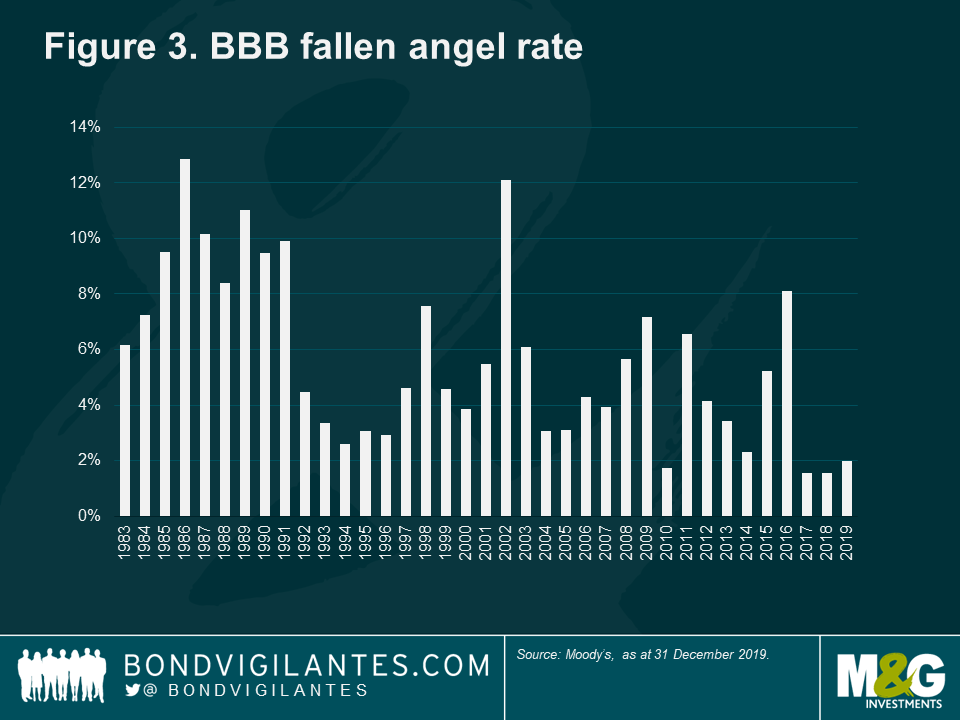
But the crisis has spurred the agencies into action. S&P, for instance, has taken negative rating actions on 383 IG rated issuers affected by COVID-19 and oil to April 17th 20201. They have junked 23 issuers so far this year2.
There is huge potential for more fallen angels. There is €243bn of BBB- rated debt in the IG index, of which €107bn is either on rating watch negative or bears a negative outlook. The fallen angel rate of BBB issuers hit 12.88% in 19863 and a similar rate would see €156bn of euro fallen angels and $457bn in the US market. Goldman Sachs forecast €180bn of fallen angels in the euro market over the next two quarters4.
The Opportunity
So we see a surge of fallen angels and expect their prices to fall due to the relative size of the IG and HY market. Is there any good news?
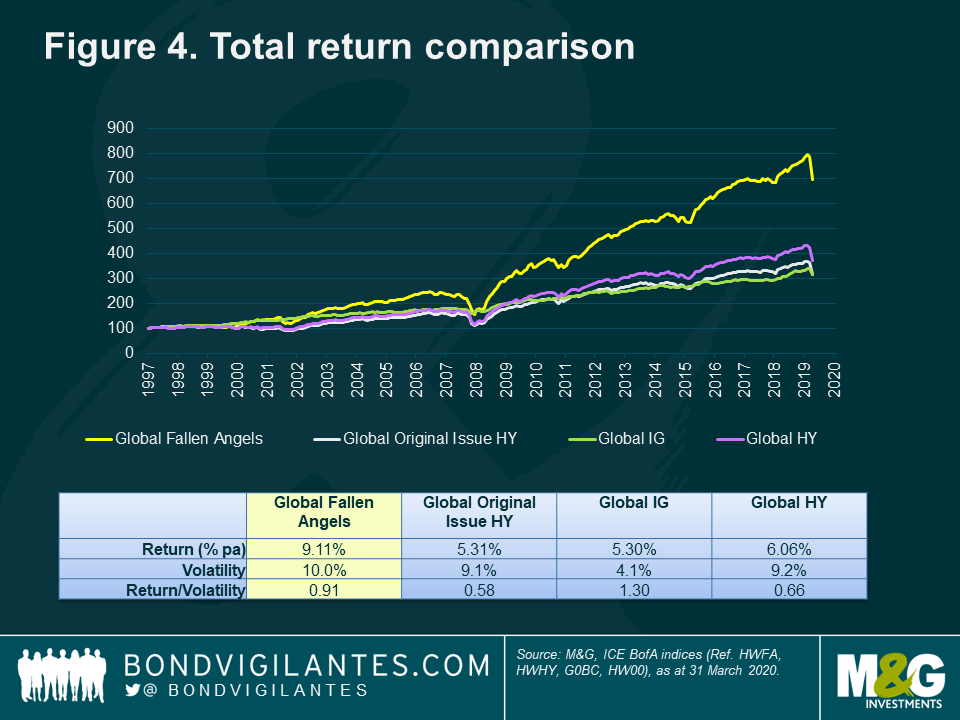
Fortunately, the answer is yes. When we look at Figure 4, which shows the performance of fallen angels versus other HY (called ‘original issue HY’) and IG, we see that fallen angels have outperformed over the long term.
The fallen angel index isn’t for the faint hearted – the size of the market waxes and wanes and will sometimes be highly concentrated. Volatility is higher than that of HY. But the long term performance is compelling as the higher returns compensate for the higher volatility. In fact, as shown in Figure 5 below, fallen angels have only underperformed original issue HY over a rolling three-year period in 10 out of the last 232 months.
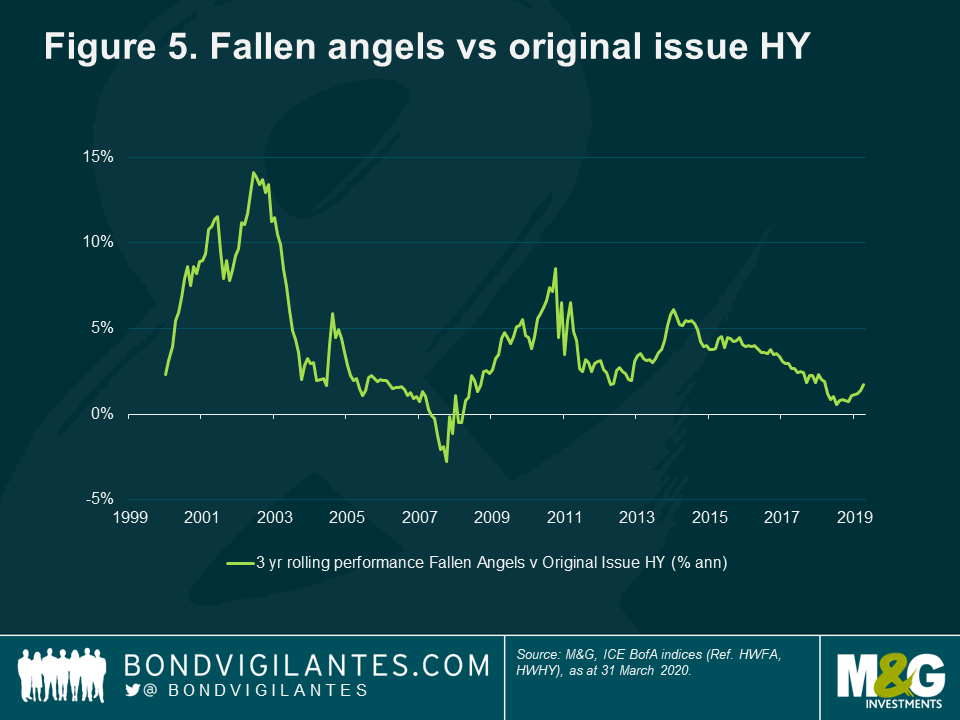
How can this outperformance be explained? It is because the prices fall initially making them cheap, and over the longer term the survivors are more likely to return to IG as a ‘rising star’ than original HY issuer.
The churn of bonds from the IG to HY market causes prices to fall, and this is exacerbated not only by the relative size of the markets, but also because IG issuers often have much longer dated bonds that are more sensitive to spread widening.
Fallen angels are both more likely to default and return to investment grade than original issue HY5. Initially, the risk of a fallen angel defaulting is actually higher than original issue HY. Fraudulent companies default soon after downgrade to sub-investment grade. Enron defaulted six days after being junked. However, after a year or so, a fallen angel has a higher chance of becoming a rising star and return to investment grade. This is because fallen angels have several of the characteristics, such as size and industry type, required to for an IG rating that other HY issuers lack.
Conclusions
We expect this current episode lead to a surge in fallen angels. This will lead to mark to market volatility in the short term as IG holders sell to HY investors. The lesson from history is that the bonds of survivors achieve outsized returns.
3 Annual default study: Defaults will edge higher in 2020, Moody’s, 30 January 2020
4 The Credit Line: The two sides of “fallen-angel” downgrades: Risk vs. risk premium, Goldman Sachs, 20 April 2020
5 What Happens To Fallen Angels? A Statistical Review 1982—2003, Moody’s, July 2003
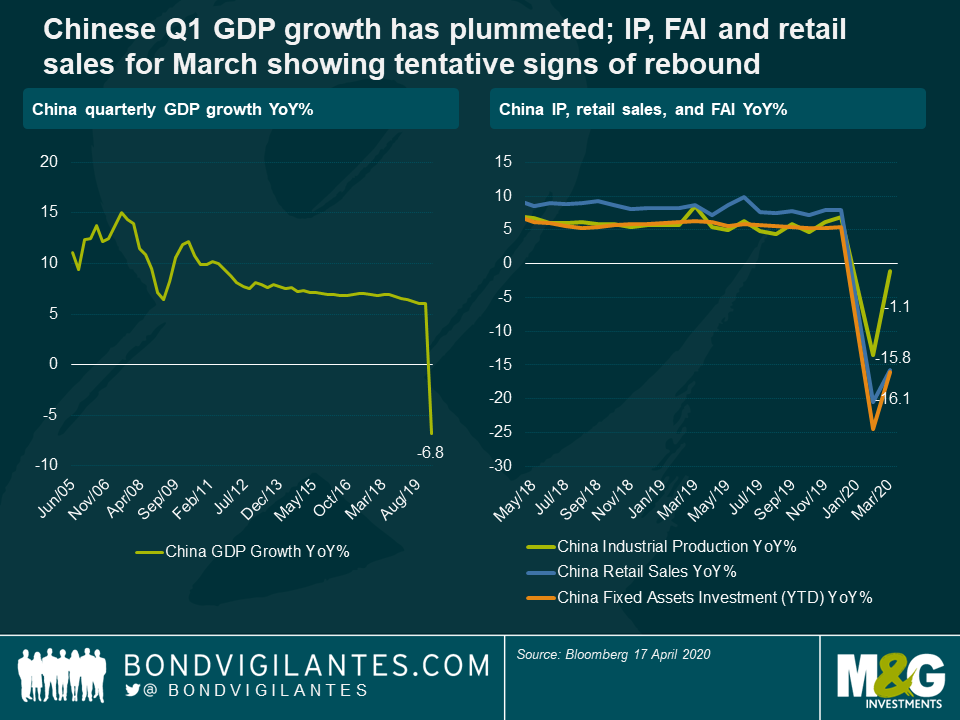
Earlier this week, China’s Central Bank (the PBoC) announced a further cut to the 1 year loan prime rate, one of its key interest rates, from 4.05% to 3.85%. This further loosening of monetary policy demonstrates that, as China attempts to extricate itself from the COVID-19 crisis, the domestic and international pressures on the world’s second largest economy remain severe, and the outlook highly uncertain. Last week’s publication of Q1 GDP growth numbers, industrial production, fixed assets investments and retail sales were illustrative of this state of affairs: some investors saw in the data signs of an economy starting to turn the corner, others a confirmation that global demand remains depressed and that the attempted re-opening of the Chinese economy post lock-down will be a slow and gradual process.
To get some clarity on what the future holds, it can be useful to look at the performance of Chinese financial markets. From an equities perspective, my colleague Rob Secker gave his views on Chinese equities in a recent blog (link here).
In terms of fixed income, given the segmentation of Chinese bond markets and the huge range of assets available, naturally there have been strong divergences in returns.
Renminbi denominated government bonds (CGBs) have fared on the whole relatively well this year, supported by the PBoC’s reductions notably to the 1 year and 5 year Loan Prime Rates (LPR), the 1 year Medium term lending Facility (MLF), and the 7 day and 14 day reverse repo rates. In addition, the PBoC has also directly injected trillions of renminbi into the banking system, through its outright monetary operations and by reducing reserve requirement ratios for banks.
Despite these moves, the PBoC has been relatively measured in its approach to the COVID-19 crisis, and therefore still has space to loosen monetary policy further should the crisis get worse. This should prove supportive for Chinese government bonds in the near term, especially as CGB yields remain more elevated than for example US Treasuries (currently 5 year CNY CGB yields are 2.0% and 10 year 2.6%). That being said, despite these higher yields in relative terms, the much reduced liquidity of CGBs versus US Treasuries, and the lingering restrictions around capital flows in China, mean that global investors will probably remain reluctant to increase significantly their participation in CNY denominated Chinese government bonds in the near term.
As for the renminbi, it has been one of the standout performers this year, especially when compared to other emerging market currencies. Because of this, on a year to date basis, CGBs are one of the best performing government bonds within the JP Morgan emerging markets local currency index (when calculated in US Dollars).
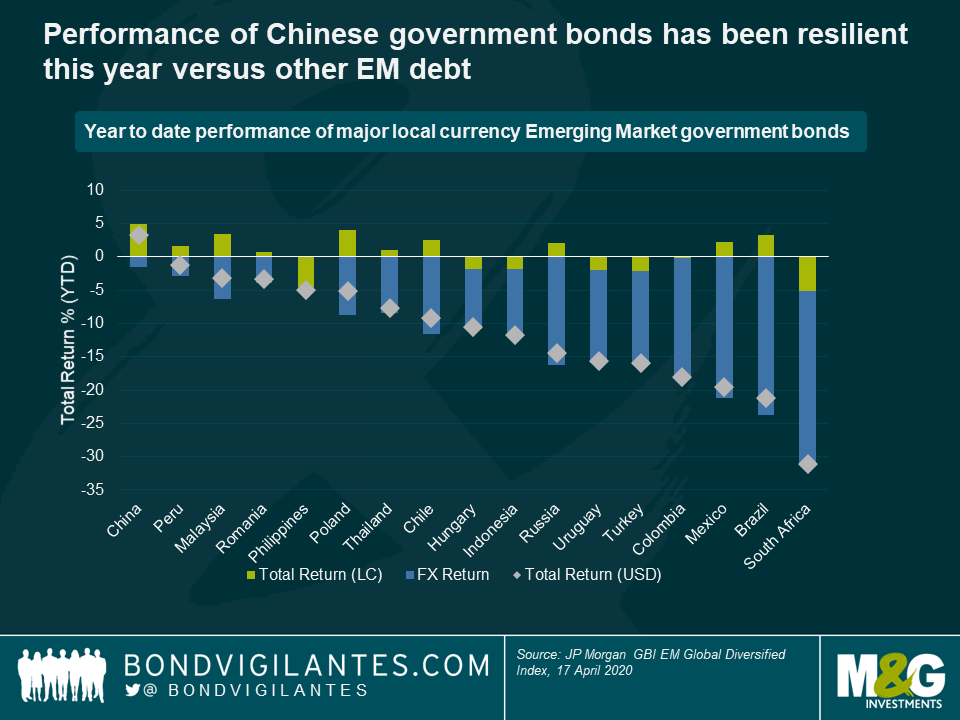
As a result of this outperformance, when compared to other emerging market currencies (especially those that have fallen sharply this year), the CNY arguably looks expensive, and is likely to underperform should sentiment around global demand and the COVID-19 crisis improve materially.
Versus the US Dollar, the CNY has on the whole weakened this year, and recently broke through the 7 CNY per USD mark once again. In my opinion, this has more to do with recent USD strength than fundamental CNY weakness, and the outlook for the CNY remains relatively robust. In addition, the PBoC has often stated that it does not purposely intend to devalue the CNY to boost growth, and that it aims to keep the CNY stable over the long term. Because of this, with the CNY now trading very close to multi-year lows versus the USD, the currency’s downside versus the USD looks to some extent capped. On the other hand, should USD valuations normalize, there is likely to be some decent upside potential for the CNY versus the USD.
Turning our attention now to credit, China’s deeply segmented markets have once again led to some quite large discrepancies in performances this year. The renminbi onshore market, despite the elevated debt levels of many state owned enterprises, has remained broadly resilient throughout this crisis and even posted small but positive returns (according to the S&P China Corporate Bond Index, a very broad measure of credit in China). This positive performance can in part be attributed to the fact that many investors in CNY credit tend to be buy and hold investors, and therefore the asset class did not suffer from the same forced selling pressures and USD funding stresses that wreaked havoc in financial markets in March. Many CNY credits also benefit to some extent from an implicit state guarantee, which makes the market generally more resilient, although of course there are some exceptions.
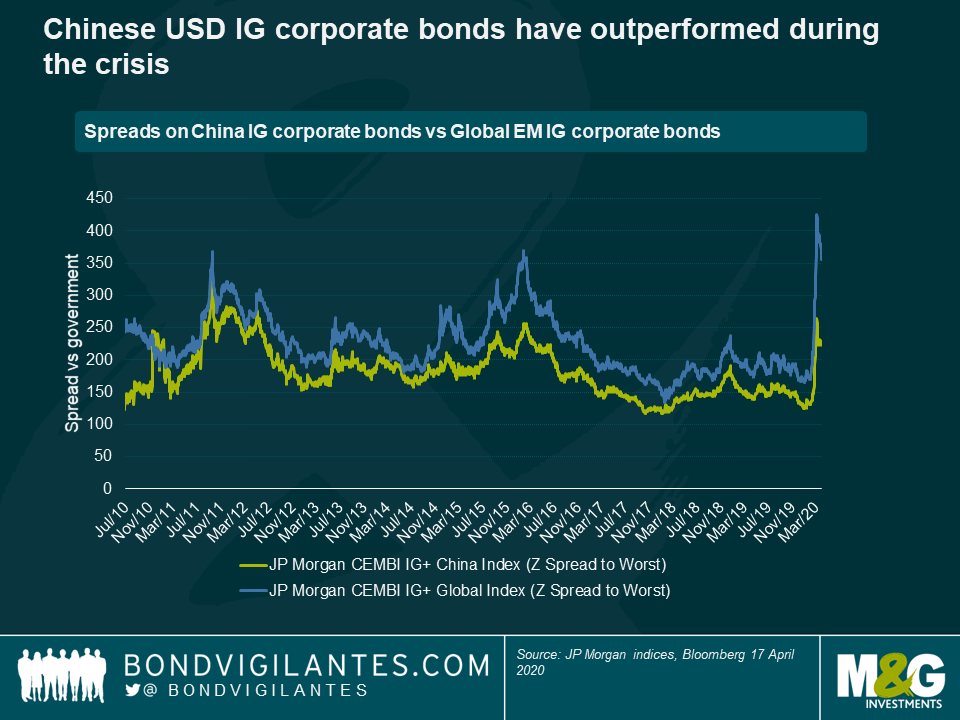
As for USD denominated corporate bonds of Chinese companies, spreads widened on the whole throughout the risk spectrum. Within investment grade, the spread widening has been relatively measured, Chinese corporate bonds outperforming the broader EM corporate IG index by over 100 basis points in spread terms this year. Some of that outperformance is probably justified by sector and quality discrepancies between China IG bonds and the wider EM index, as well as the general historical resilience of Chinese credits. But on the whole it means that, from a purely valuation perspective, there are now more compelling buying opportunities for EM investors outside of China today. This relative richness of Chinese IG credit is also exacerbated by the lack of transparency of some Chinese corporations, as well as lower levels of liquidity.
As for Chinese USD high yield bonds, after selling off massively and spreads rising to over 1,100 basis points in March, they have now retraced some of those gains and are trading around 850 basis points on average (JP Morgan CEMBI+ indices). Most of these bonds are from highly levered real estate companies that have been directly impacted by the virus outbreak, so they are not without risks. But if one focuses on those companies with stronger balance sheets, lower liquidity requirements and access to onshore funding, there are likely to be some interesting investment opportunities, on a selective basis.
Ultimately, while the COVID-19 crisis is unprecedented and has rocked financial markets, investors can be reassured by the resilience this year of Chinese government bonds and the CNY currency. As for USD denominated Chinese credit, there may be some attractive opportunities on a case by case basis, especially in the more speculative high yield space. Of course, investing in China is not without its risks. The country remains under fire internationally for its apparent initial handling of the crisis, and it is likely that the trade tensions that emerged last year will probably come back to the fore at some point. It also remains unclear at this stage whether the virus can be contained purely through social distancing measures, mass testing and isolations. Without a proper cure or vaccine readily available there could still be a second wave of infections.
Whatever your view, as the first country to be impacted by the virus and having now been able to curb the spread (at least momentarily), it is important to continue to look to China as it pursues its course towards normalization and the re-opening of its economy.
While it is certainly too early fully to understand the impact of COVID-19 on economies around the globe, one thing is for sure: the shock to economic activity is going to be enormous in the short run as sectors of the economy simply shut down. Having experienced one of the biggest corrections in history last month, financial markets have started to be somewhat more upbeat of late. Market participants have welcomed the robust and coordinated response from policy-makers around the world. Central banks of major economies have stepped up their game, using a whole repertoire of unconventional measures to ensure markets continue functioning. Just last week, the Fed went beyond what any central bank has done before, by expanding its purchases to include high yield exchange traded funds and fallen angels. This will undoubtedly give a confidence boost to high yield investors and the BBB-rated segment of the IG market.
We have also seen a conventional policy response from central bankers in the form of interest rate cuts but, interestingly, these actions have been very different across the developed world. In fact, we can witness a two-tier response: that in economic areas with positive policy rates, and that in those with zero/negative policy rates. The chart below shows the change in interest rates of eight central banks since the start of 2019. While large interest cuts followed swiftly when the virus started to spread in those areas with positive interest rates, central banks with zero or negative rates (dotted lines) have refrained from cutting any further. This, despite all countries having to prepare for a severe economic downturn.
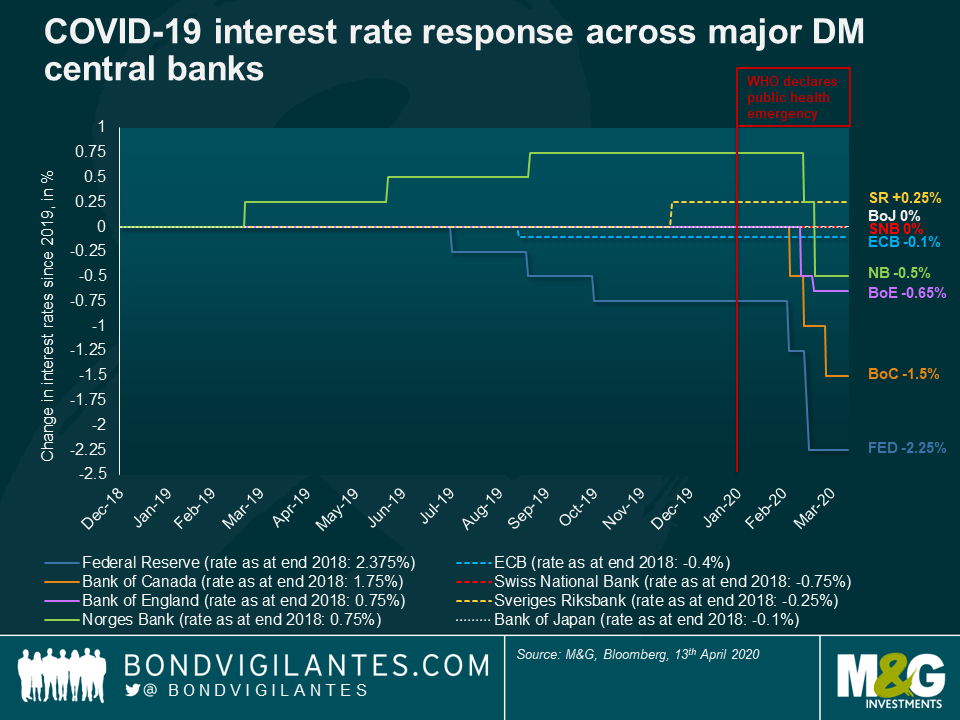
Amongst those not willing to cut, Switzerland belongs to the countries hardest hit by the virus, even surpassing Italy in infection rate per capita. The country’s policy rate is set at -0.75%, the lowest around the globe. For a long time, the Swiss National Bank (SNB) used to move in lockstep with the ECB to keep the EUR/CHF exchange rate range bound. This is important given that two thirds of Swiss exports go to the EU. However, in September 2019, the SNB changed its strategy. The ECB cut rates but the SNB didn’t, despite having cut its growth forecast in half from 1.5% to 0.75% at the same meeting. Maybe this meeting marked the turning point when the SNB silently acknowledged that the side effects of negative rates, which do hit bank profits and pensions hard, had started to outweigh the benefits.
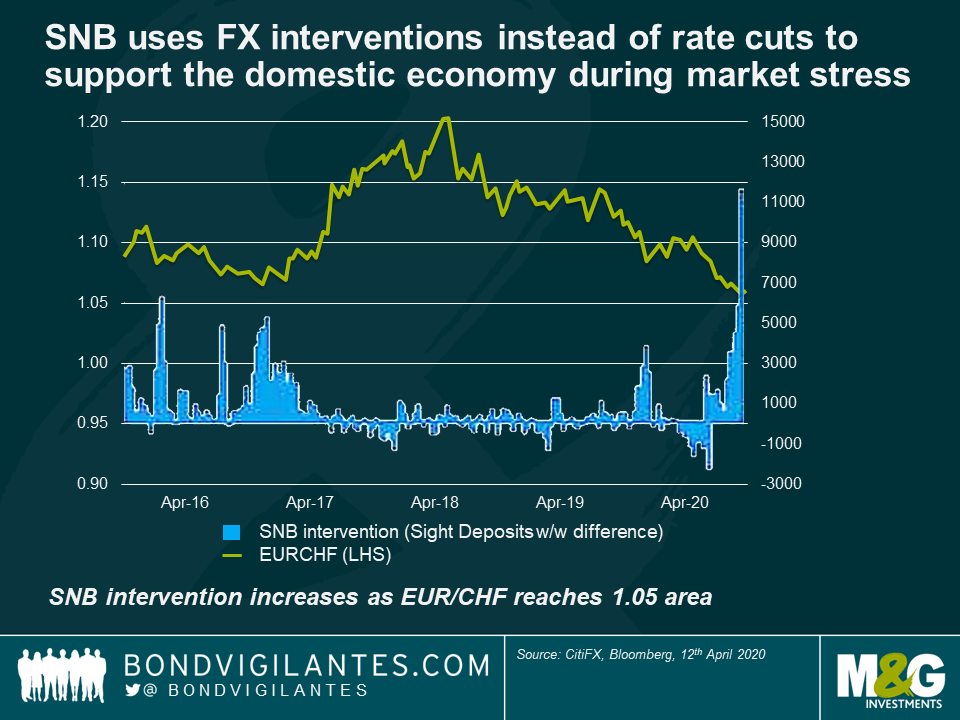
Not cutting rates further last month while the country has gone into complete lockdown adds further evidence that the deeply negative policy rate is outside the SNB’s comfort zone. To compensate for the lack of rate action, we have witnessed more unconventional policy measures from the Swiss National Bank in the form of more aggressive deposit tiering to support banks (exemptions for banks from negative rates currently applies up to 30 times their minimum reserve requirement!), as well as FX interventions to prevent the EUR/CHF from falling below 1.05.
The example of the Swiss National Bank is certainly the most extreme, but the bank is not alone in questioning negative rates. Back in December last year, the Riksbank lifted the repo rate by 25bp returning it to 0.0%, notably at a time when the Swedish central bank’s own projections of inflation over the next three years remained below the 2% target. And just days ago amidst the corona crisis, Fed chair Jerome Powell told reporters in an interview that negative policy rates are unlikely to be an appropriate policy response in the United States.
Let’s take this one step further. If it is indeed true that we are close to, or in certain circumstances have reached, the lower bound in interest rates, this has important implications for fixed income portfolios. With limited room to cut rates further, the ability of such risk-free assets to act as a shock absorber in economic downturns has been reduced meaningfully. The chart below shows that the correlation between the Swiss Market index and Swiss government bond yields has been much lower during the COVID-19 sell-off compared to previous crises.

There is a reasonable chance that we will look back one day and say that it was the COVID-19 crisis which uncovered the limits of conventional monetary policy. Maybe we are just witnessing the first severe economic crisis in which major central banks in the developed world—in the absence of inflation—refuse to cut rates.
In the last two weeks, both the ECB and the PRA effectively demanded that banks stop paying shareholder dividends and buying back stock for at least six months. The announcements, even though they were leaked in the press well before official confirmation, sent bank share prices plummeting, as investors saw what had been improving income streams in recent years come to an abrupt halt. It also threw a spanner in the works of the market for bank capital securities. Are the banks in so much potential trouble that they required this unprecedented, capital-conserving move? Are regulators still trying to punish the banks a decade after the Great Financial Crisis (GFC) of 2008-09? Are other bank capital instruments next in line for a blanket payment restriction? The answers to these questions are no, no, and no.
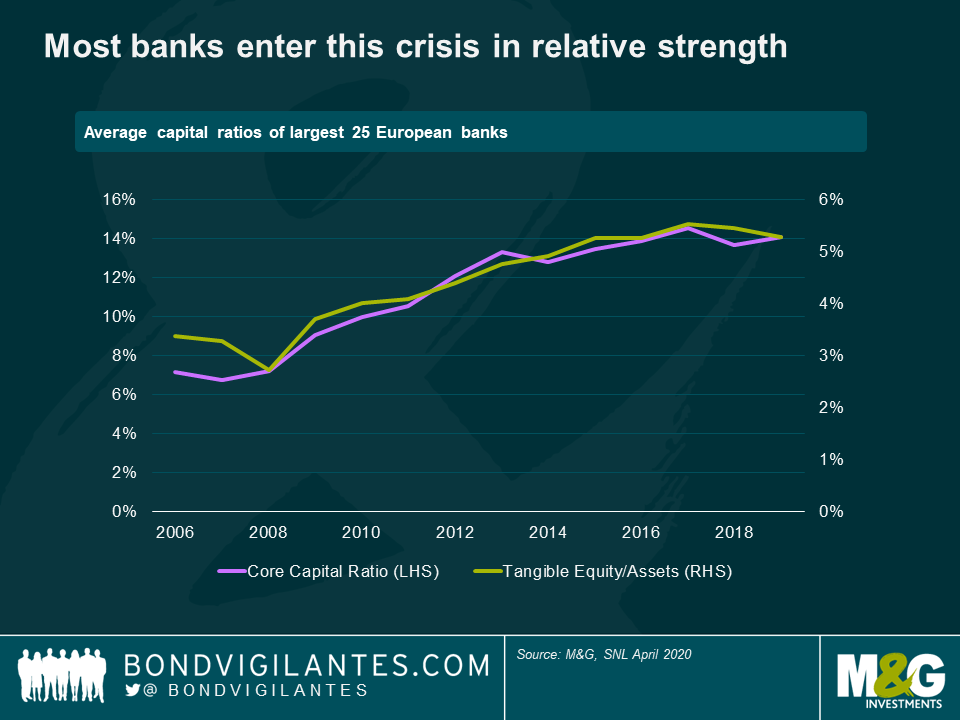
There is little doubt that loan losses at banks will rise considerably as a result of the Great Coronavirus Crisis (GCC). And depending on its longevity and severity, some or most banks may see capital levels drop meaningfully. But most banks are coming into this crisis from a position of relative strength (see chart below), and these capital-conserving moves by the regulators should be taken in the context of other measures to combat the economic fallout from the global lockdown. When considered in this light, one can appreciate that the banks have become, at least temporarily, a key transmission mechanism for governments’ efforts to mitigate economic decline. This has important implications for debt investors, as the risk profiles of bank debt have changed.
Government and central bank support measures have been numerous, swift and sizeable. In addition to dividend restrictions and a massive expansion of unemployment benefits, these measures include:
These actions will be effective only if there are banks around to implement them, and do so willingly (though perhaps begrudgingly in some cases). Regulators are therefore keen to keep banks alive and functioning as long as the crisis continues and well into the recovery, and keep their access to capital markets open. In this light, the decision to halt dividends was a rational, precautionary move, designed to protect the authorities’ transmission tool (the banks) in a highly uncertain environment. Guidance around loan loss recognition has a similar purpose – to give banks the ability to lend in the near-term by “flattening the loss curve”, just as countries try to flatten the coronavirus infection curve. It’s the same for the softening of capital requirements, and the provision of liquidity.
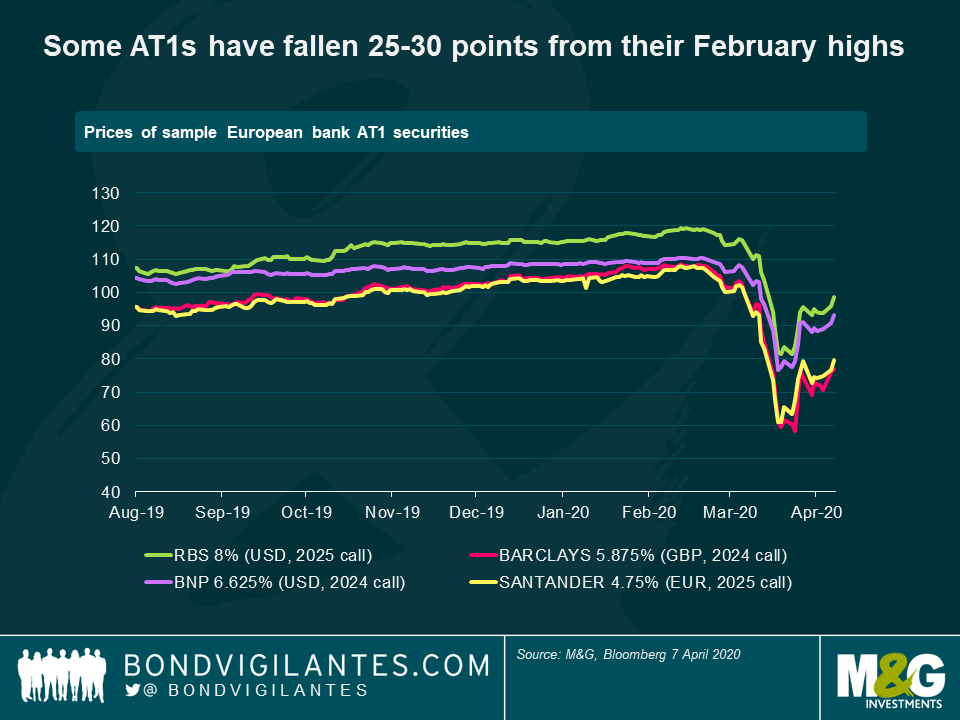
So what does this mean for bank investors? Different things for different parts of the capital structure. Consider Additional Tier 1 (AT1), the perpetual, callable hybrid securities that sit just above equity. These pay a regular, fixed amount to investors that would automatically be halted if prescribed capital “buffers” are not met, or could otherwise be halted at the whim of regulators. Prices on UK & European AT1 fell 2-4 points when the shareholder dividend restrictions were announced, even though these were clearly out of scope of the regulatory decrees. In fact, the regulator demonstrated respect for banks’ capital hierarchies by not restricting AT1 coupon payments, and later confirmed they expected AT1 payment restrictions to be determined by existing triggers (e.g., capital levels falling below pre-set buffer levels). This too is a rational, reasonable approach, since a bank can always pay out a restricted shareholder dividend at a later date, but can’t do so with cancelled (or “skipped”) AT1 distributions. Nonetheless, some AT1 instruments are still 25-30 points off their February highs, reflecting both payment and extension risks (see chart below).
There should be little doubt that AT1s are risky instruments, particularly so in the current environment. In addition to coupon skips, they could be written down or converted into equity in the case of severe capital shortfalls. Coupon skips are certainly possible if there is a protracted downturn – some banks may see their capital fall below required buffer levels as losses mount – but what about writedown risk? AT1 writedowns are supposed to be triggered when regulators consider a bank to be “non-viable” (in theory it would also happen when the bank’s core capital ratio falls below a pre-set level, usually no higher than 7.0%, but historically the non-viability designation has happened before capital has fallen that low). But a non-viable bank is also a bank that can’t help enact government policy, so letting banks go that low on capital doesn’t sound like good policy at the moment. It’s therefore our view that AT1 writedowns, at least at systemically important banks, are considerably less likely than coupon skips during this crisis.
Unlike AT1s, senior and subordinated bank debt are “must-pay” instruments, but these too are affected by the use of banks as policy transmission tools. Regulators across Europe have lowered so-called counter-cyclical capital buffers to zero, told banks they can breach capital conservation buffers, and are also permitting temporary breaches of liquidity requirements, all so banks can continue to lend to the real economy. These measures give banks additional cushions against regulatory intervention, which should benefit bank senior and subordinated debt, all else equal, at least in the near-to-medium term.
There is of course a downside to all these actions. We must not forget that while governments and regulators will likely be eager to support both banks and banking systems to soften the economic impact of the crisis, the flexibility they are giving banks now on capital and loss recognition creates transparency and credit risks down the road. And all the while, lower-for-longer rates will continue to drag on bank profitability. But if policymakers are successful in supporting a post-crisis recovery, those risks are much more attractive than the alternative of letting banks flounder now. In the GFC, the banks were in bad shape and needed their governments. In the GCC, it may be more accurate to say the governments need the banks.
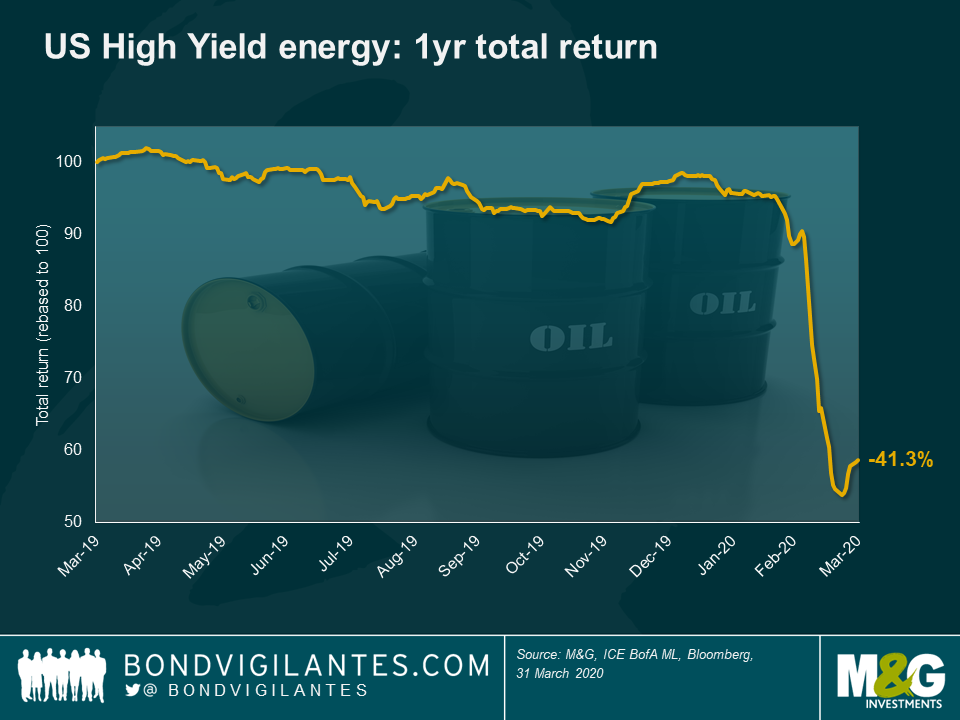
1. What’ s happened to the high yield market in the last month?
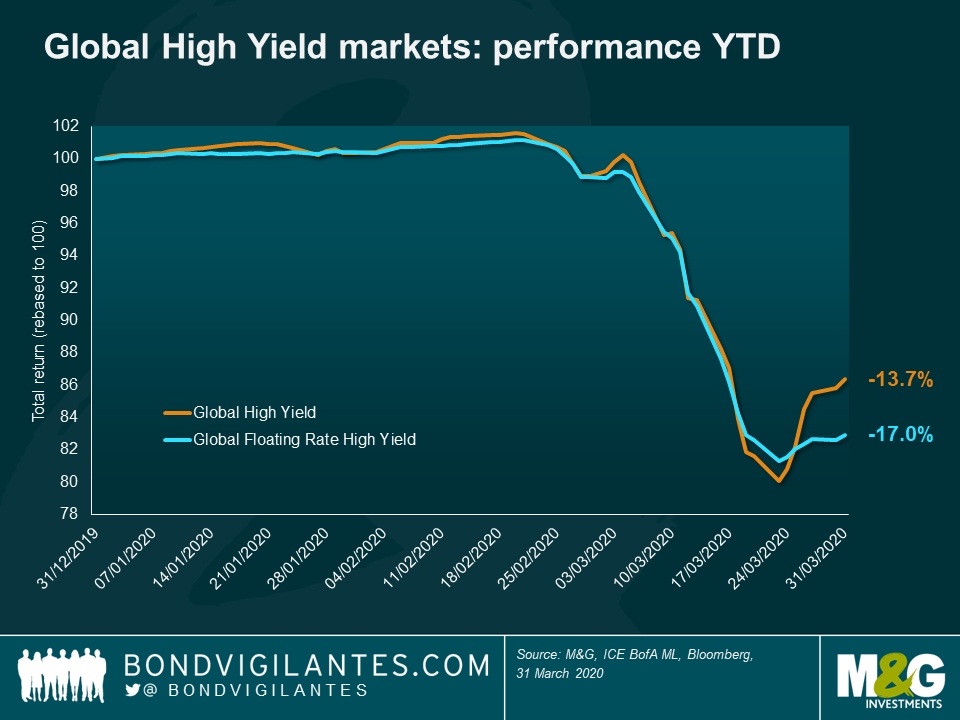
We’ve seen negative returns of -12.7% for the global high yield market. Following a weak February this brought the Q1 return to -13.7%. To put this in context, this was the second worst month and second worst quarter since 1998. Only October 2008 and Q4 2008 saw a more negative drawdown for the market.
2. Can it get worse?
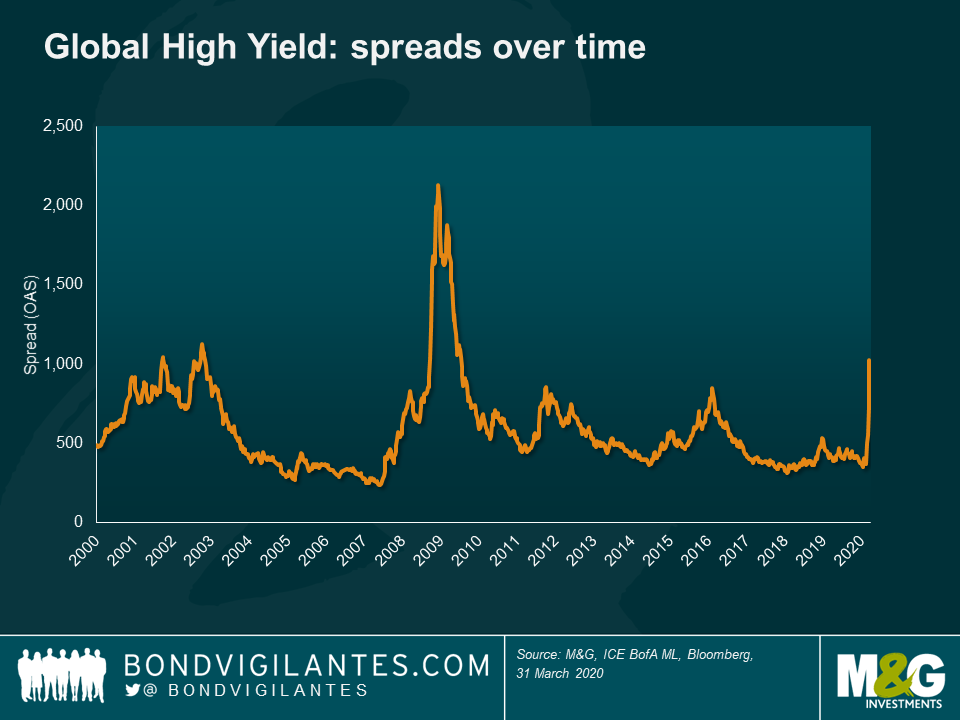
Yes, but I think probably not that much worse. Over the long term, spreads have been wider (topping out at over 2,000 basis points following the Lehman Brothers bankruptcy – see the chart below), and they are currently hovering at just under 1,000 basis points. It is hard to pinpoint the bottom of this particular market cycle. It may have been a few days ago, it could be in a few months’ time, but what gives me some hope and comfort that it might not get much worse is that:
3. Will there be more defaults?
Definitely. Global default rates were in the low single digits for high yield coming into this. There is no doubt that we will see more companies restructuring their debts and in some cases failing altogether and going into liquidation. I would make two points here:
On the other hand, food retailers, packaging businesses, Technology, Media and Telecom companies, pharmaceuticals and healthcare operators (which are all big parts of the High Yield market) will either see relatively limited impact to their businesses or in fact an upturn.
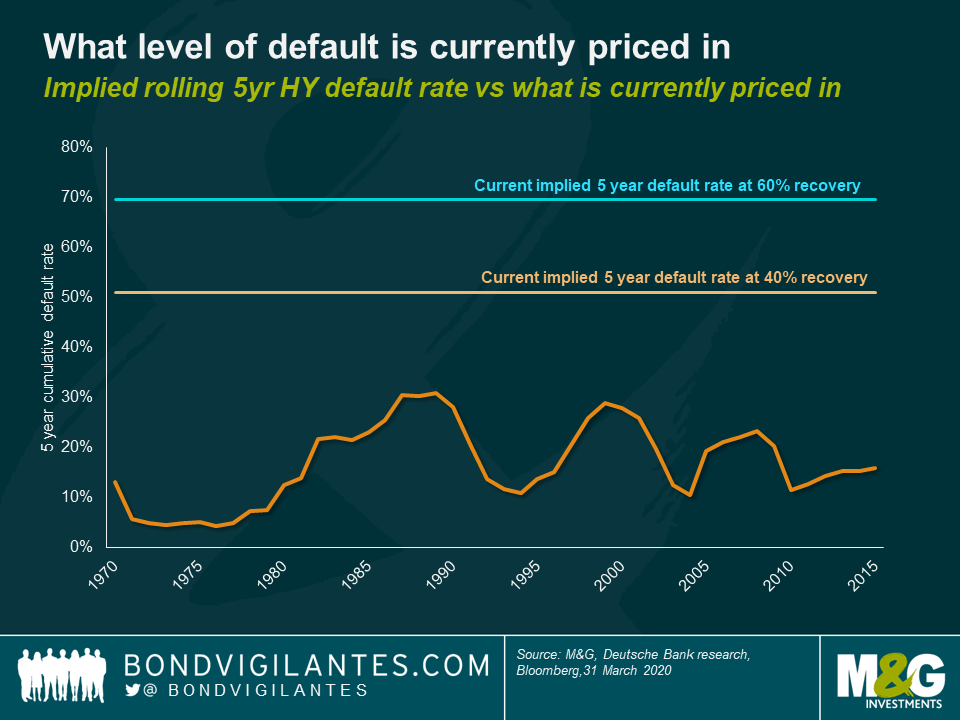
4. So defaults are going to rise but what’s priced in in terms of default rates?
Quite a lot of the bad news is priced into spreads, and then some. If we look at the chart below, five year cumulative default rates of a little over 50% are now priced into the market (assuming a 40% recovery). For investors focused on senior secured debt (e.g. senior loans and FRNS), the implied default rate in spreads is even more pessimistic at just under 70% over five years (assuming a 60% recovery). As we can see below, historically, the peak for five year default rates has been 31%. I would argue that the market is already pricing in a very extreme and painful scenario for defaults. Of course there will be losses for bondholders, but I struggle to see losses of this magnitude. Consequently, I think high yield valuations currently look cheap.
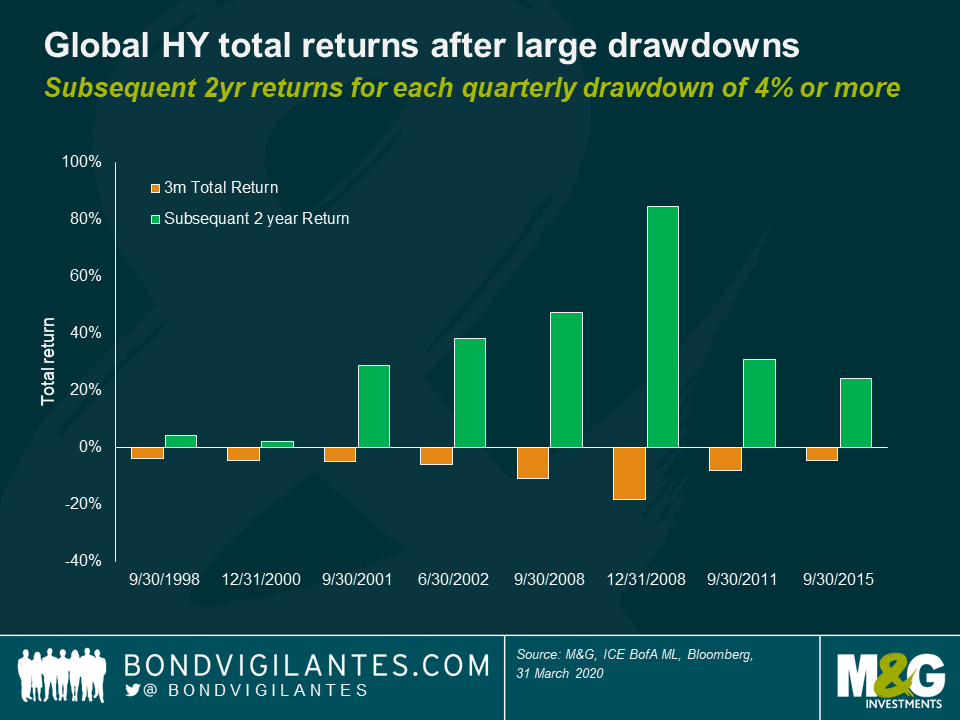
5. What’s the potential upside for investors?
In the short term, no idea. The market is still very volatile and fairly illiquid. We could well see more short term losses rather than gains. However, in the medium to long term (e.g. a time horizon of say two years), the potential returns could be meaningful. Again, if history is any guide, the chart below shows the subsequent two year returns from the global high yield market following a quarterly drop of 4% or more. Over the past 20 years, this has always generated a positive return, and indeed over the last six such dips the returns have been in excess of 20% over the following two years. This is not inconceivable either at this point in time. If for example the market has a spread of 1000 basis points, and in two years’ time this normalises to circa 400 basis points (a level consistent with more recent history), with four years of spread duration that would mean a potential capital gain of 24%. So all in all, certainly not without risk, volatility and defaults, but also potentially quite rewarding.
“Inflation is as violent as a mugger, as frightening as an armed robber and as deadly as a hit man.”
If that is the case then developed economies have not encountered any muggers, armed robbers or hit men for some time.
That quote came from Ronald Reagan, candidate for US President in the late 1970s, back when controlling inflation was one of the biggest challenges for governments and central banks.
We are a world away from there today, where the bigger danger is deflation. Central banks and governments are doing their utmost to stimulate the economy by any means possible, including low/zero rates, buying back government debt and pouring out direct stimulus to combat the slowdown caused by COVID-19.
Where did the mugger go? Globalisation ended his career. One by one, as markets began liberalising, there were no pinch points for the mugger to exploit. From the single market in Europe and NAFTA in North America, to China (and the countless other countries that followed) becoming part of the WTO, measures were put in place to ease the flow of capital and goods across borders or remove them altogether.
The 10 year US Treasury yield peaked at 15.7% in October 1981, and has been on a downward trajectory since with deflationary pressures muted. Global supply chains grew, costs were kept under control, and for every Thailand that developed and saw cost pressures rise, a Bangladesh would enter the family of global nations and offer the mugger no respite.

The landscape had begun to shift before the world had ever heard of COVID-19. While freeflowing movement benefitted the owners of capital, there were parts of the labour market that had seen wage deflation for nearly 25 years. These are the groups now voting for Brexit in the UK, Front Nationale in France, Matteo Salvini in Italy, Donald Trump in the US, Jair Bolsonaro in Brazil and Rodrigo Duerte in the Philippines.
A retrenchment of global supply chains already had the potential to recreate domestic inflationary pressure. And then along came COVID-19. With dramatic effect, the virus has shown the weaknesses in global supply chains and, for the first time post World War II, led to governments all across the world closing their borders and airspace.
A long term consequence of this global pandemic may be that localisation of supply chains becomes prominent again, both from companies and from governments which will prioritise security and accessibility over costs.
Going big… and the Treasury bear
‘If you’re going to go big, just go big.’ Republican President Donald Trump told Treasury Secretary Steve Mnuchin, who put together a $1 trillion stimulus package in the US last week.
Wanting a quick passage, the Democrats added a further $1 trillion to the package to guarantee its immediate approval. There we have the largest stimulus package in US history, nearly three times the size of the TARP (Troubled Asset Relief Program) package introduced in the wake of the 2008 financial crisis.
The financially conservative German government followed with a €750bn stimulus package of their own. Meanwhile, the EU suspended the debt and deficit requirements across the European bloc. There have been countless more such measures all across the world.
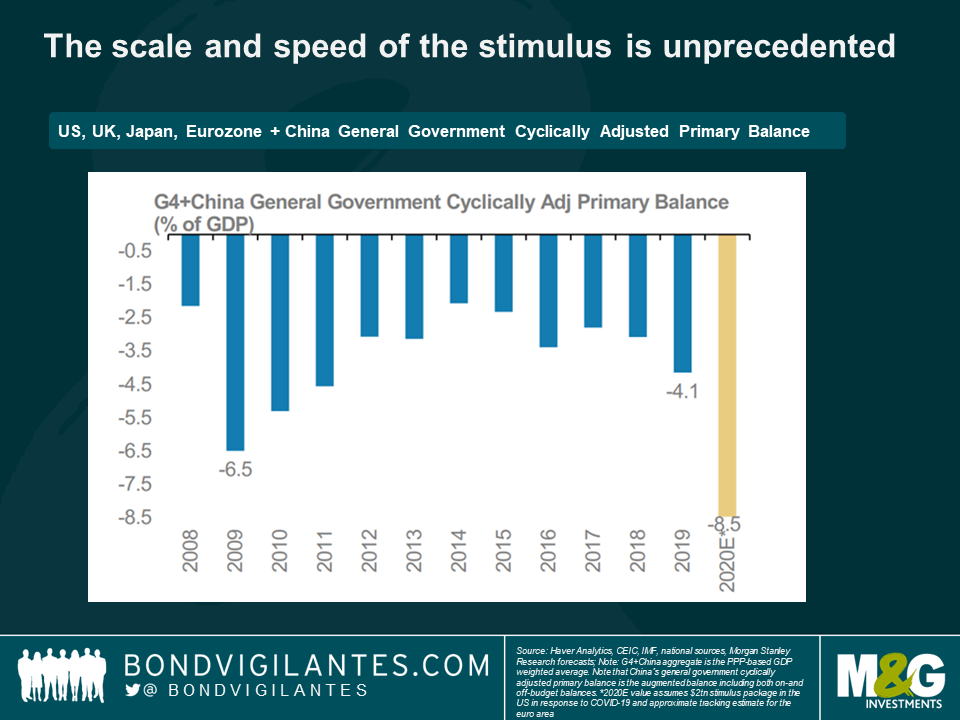
While stimulus measures are required in times of large unexpected shocks, the scale and speed of the stimulus we have just witnessed is unprecedented. The economic costs of COVID-19 are still unknown: policy makers have thrown caution to the wind and planned for the worst case scenario.
Should the slow but increasingly important trend of trade barriers begin to rise, and there be excess stimulus in the world economy once we have returned to some level of normality, we are likely to see some longer term economic implications.
The death of the more than 30-year bull market in US Treasuries has been predicted many times. It will require sustained inflation in the system to force longer term interest rates up. While our minds could not be further away from that thought today, the ingredients for this eventuality are all just going in to the mix.
Policy choices have unintended consequences, especially when they are made in times of extreme pressure. For those who are scared of muggers, please take note.
To date, there have been several packages announced by multilateral financiers that will support African countries with their Covid-19 responses. These packages are urgently needed: first, to finance the health response and, second, to cushion the economic impact.
The IMF has announced $1 trillion of firepower to help the global response to the health, humanitarian and economic impacts of the Covid-19. $50 billion of this is earmarked for low-income and emerging countries. Ten-year interest-free loans have already been announced for lower-income countries, including Rwanda, Senegal and Madagascar. The World Bank has also announced that $160 billion will be available over the next 15 months, and has begun approving emergency financial packages. The African Development Bank is also providing substantial capital, including via a $3 billion social bond it issued last week.
Debt pressures
Even with the rescue financing, some African countries’ capacity to repay debts could be overwhelmed. This is because many African countries had debt pressures even before the outbreak of the virus. At the end of last year, 19 lower-income African countries were in debt distress or at high risk of debt distress according to the IMF and World Bank.
This led the IMF and World Bank on 25th March to make the call for “all official bilateral creditors to suspend debt payments from IDA countries [lower income countries that qualify for highly concessional borrowing from the multilateral lenders] that request forbearance”. Meanwhile, a group of African finance ministers urged for $100 billion of financing, and reemphasised the need for debt relief via a statement from the United Nations Economic Commission for Africa.
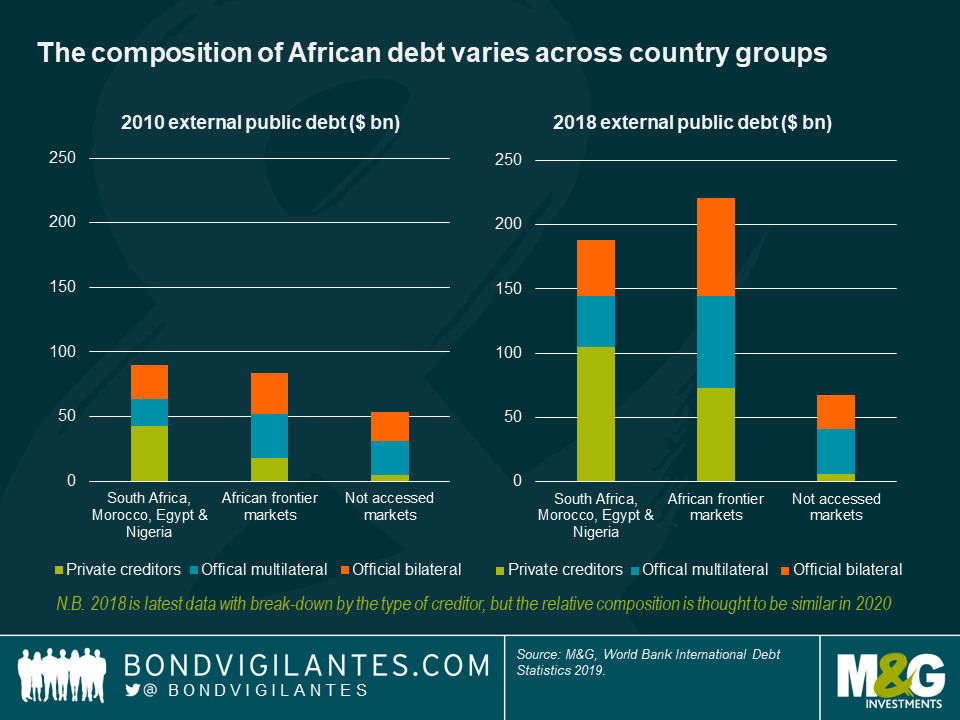
Historically, securing debt relief has been a long process taking many years. To be useful in 2020, debt relief would need to be provided at unprecedented speed, at a time when African debt stocks have become more complex following the growing diversity of creditors. When the G8 countries, the main members of the Paris Club—a group of creditors who try to find sustainable and coordinated solutions to countries’ debt payment problems—announced sizeable debt relief in 2005, Africa’s debt stock was mainly owed to them directly, or to the multilaterals (whose boards the Paris Club members dominate). Since 2010 however, the composition of Africa’s debt has changed, with 20 African countries accessing the markets and the emergence of China and other non-Paris Club lenders. Whatever plan emerges, it must take this new reality into account.
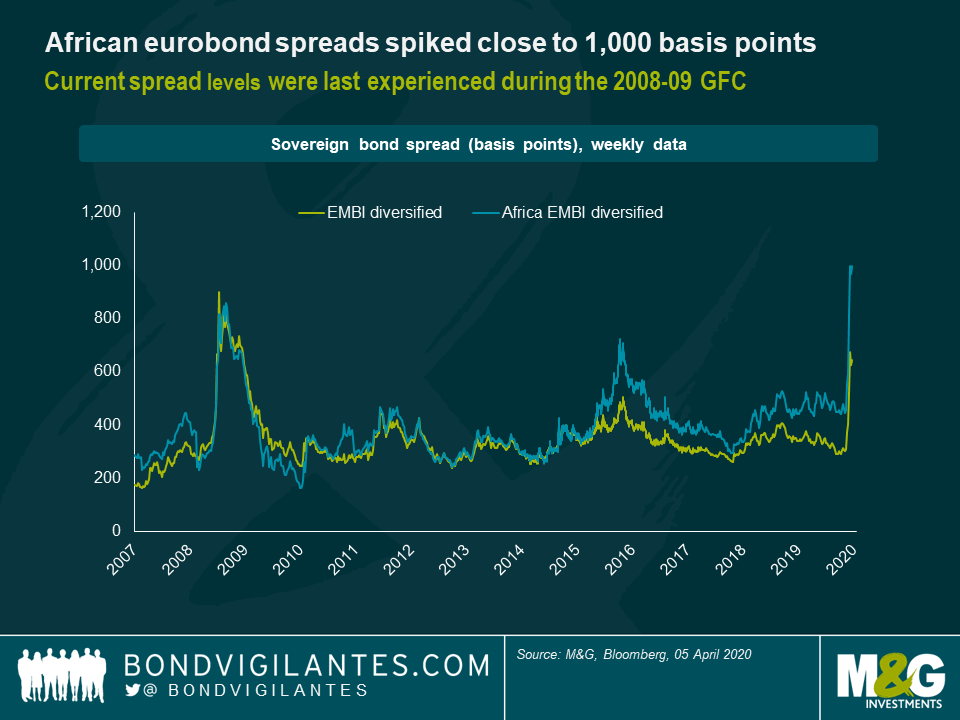
While there are debt pressures from coupon payments, there are very few African eurobonds requiring repayment in 2020 or 2021. The only large maturities due this year are from South Africa (paid in March), Egypt (at the end of April), and Morocco (in October). These could be met without any new borrowing. Thankfully, no bonds come due from smaller sovereigns: African bond spreads spiked close to 1,000 basis points, signalling that any refinancing would be problematic at present.
The new composition of Africa’s debt
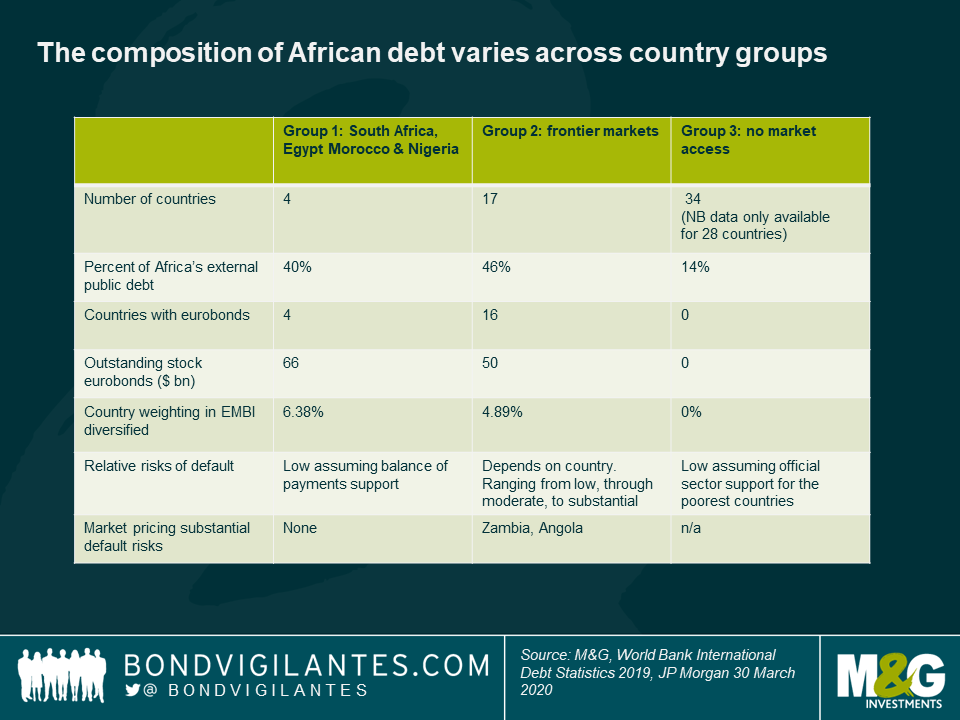
There are 54 African countries with a wide variety of debt stocks, but a broad three tier typology of countries is helpful to understand the debt challenges.
Support to the ‘Group 1’ larger economies
This group’s needs vary by country but each needs the markets to stabilise and outflows to halt for better financial health. South Africa and Egypt both need to secure IMF programmes for balance of payments support. South Africa’s economy was under pressure even before markets seized up, and a lockdown of its economy has been required in response to a growing number of Covid-19 cases. Egypt is also trying to contain an outbreak, while foreign exchange inflows have decreased from tourism, the Suez canal receipts, remittances, and as more risk averse foreign investors have pulled-back from their domestic debt.
Nigeria is the only country in this group that could access more concessional support, and could even be included in an effort to suspend payments on official bilateral debt. Nigeria is completely oil-dependent and has been under intense pressure from lower oil prices. Meanwhile, Morocco appears relatively more stable than the others, with a credit rating agency affirming its investment grade rating. Morocco also has a precautionary IMF program that could be increased in size.
Support to the ‘Group 2’ frontier economies
This is where the biggest debt challenges are. There is a risk that, for some of these frontier countries, the health and economic crisis also becomes a debt one. This could include a request for the suspension of bilateral official debt repayment by some countries, and in others an extension of debt repayment difficulties to bilateral, multilateral and commercial obligations.
Zambia and Angola are most at risk in this group, having been vulnerable before Covid-19. Markets are now pricing their default. Neither must repay any eurobonds in 2020 and 2021, but there are large amortisations due to China and on other commercial debts this and next year. Angola has an already large IMF programme in place, while Zambia urgently needs one. But unless China—a large creditor to both—also provides some sort of relief, there will not be any meaningful change to the 2020 debt burden. The G20 virtual meetings are essential here, as it is one forum where China and the United States are on the same conference call.
Meanwhile, a second tier of risk comes with Ethiopia, Ghana and Gabon who, while being more resilient, are also subject to the impacts of the global recession and may yet tragically face their own large domestic virus outbreaks. For each of these countries, scaled-up concessional financial support from the official sector will be essential in 2020.
Benin, Cameron, Ivory Coast, Ethiopia, Ghana, Kenya, Mozambique, Senegal and Zambia are all ‘IDA countries’ in global debt markets, meaning that they have the potential to be candidates for some form of debt payment suspension by bilateral creditors in line with the IMF and World Bank announcement.
Support to the ‘Group 3’ no market access countries
Countries in this group have either low debts, or have less complex debt stocks from fewer creditors, dominated by a more patient official sector. The risk of an additional debt crisis is lower for them. Despite this, Covid-19’s health and economic impacts could be catastrophic in some low-income countries with large numbers of people living below the extreme poverty line. The urgent need is for official financing for health, humanitarian needs and to counter the economic impacts. Any available grant financing is likely to be applied to the poorer countries in this group, along with interest-free loans.
Uncertainty ahead
While the impacts on African countries of the global recession are now playing out, it is hard now to predict how severe individual country’s Covid-19 outbreaks will be. While advanced economies can currently borrow at exceptionally low interest rates for their stimulus, African countries do not have this luxury. It is at times like this we need to be thankful for the international organisations, as a global pandemic requires a coordinated global response.
The intricacies of the US residential mortgage market may be unfamiliar to many European investors but the recent technical factors at play have made it one of the most interesting parts of the credit markets recently. Over the last few weeks, we have seen acute liquidity issues and forced selling from market participants in certain areas.
The US residential mortgage market covers a wide variety of mortgage related issuers, from those that are backed by the government agencies Fannie Mae, Freddie Mac or Ginnie Mae (so called “Agency” mortgages) and those that are not, for example jumbo mortgages, fix and flip mortgages, non-qualifying mortgages, single family rental, scratch and dent, and reperforming mortgages (“non-Agency” mortgages).
US mortgage rates, particularly agency mortgage rates, have historically tracked US Treasury yields within a small range and only deviate in times of acute consumer stress, for example in 2008–09. However, as Covid-19 spread globally in early March, banks, brokers and the end-buyers, usually so prevalent in trading US agency mortgage bonds, began to shrink their holdings as liquidity became ever more valuable. As a result (see chart below), the 30 year agency mortgage rate spread above US Treasury yields widened to levels not seen since 2008, driven by liquidity issues rather than fundamental risk.
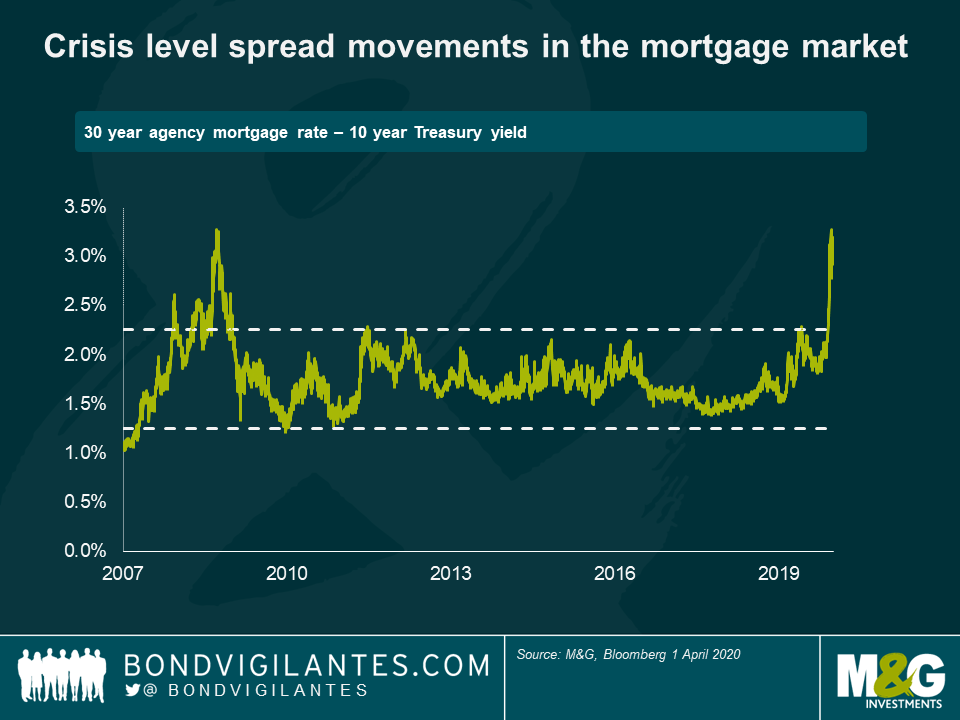
This posed a significant problem for the Fed, who partly rely on the transmission from rate cuts to Agency mortgage rates to stimulate the consumer. Even as the Fed was cutting rates, mortgage rates were rising. The resulting price drops in Agency RMBS also created extreme paper losses for many levered holders of Agency RMBS, who had to pay increasing cash collateral amounts to cover these mark-to-market movements under the terms of their repo arrangements with the banks, or be forced to sell the assets. In these repo agreements, holders of securities (in this case, RMBS) use them as collateral for short-term, mark-to-market, recourse borrowing from banks – should the value of the collateral fall below an agreed amount, the borrower must post extra cash collateral with the bank.
The same and more was true in non-Agency mortgages. Whilst the non-Agency mortgage market is not as big as it was in the lofty heights of 2006 (which saw $1.28trn of new issuance in the space), the market is still extremely large with $63.7bn of new issuance in 2019 and $850bn outstanding as at Q2 2019. The non-Agency market has been subject to an even greater technical effect and liquidity crisis and, in addition, the prospect of higher credit risk, resulting in even greater price falls than in Agency RMBS.
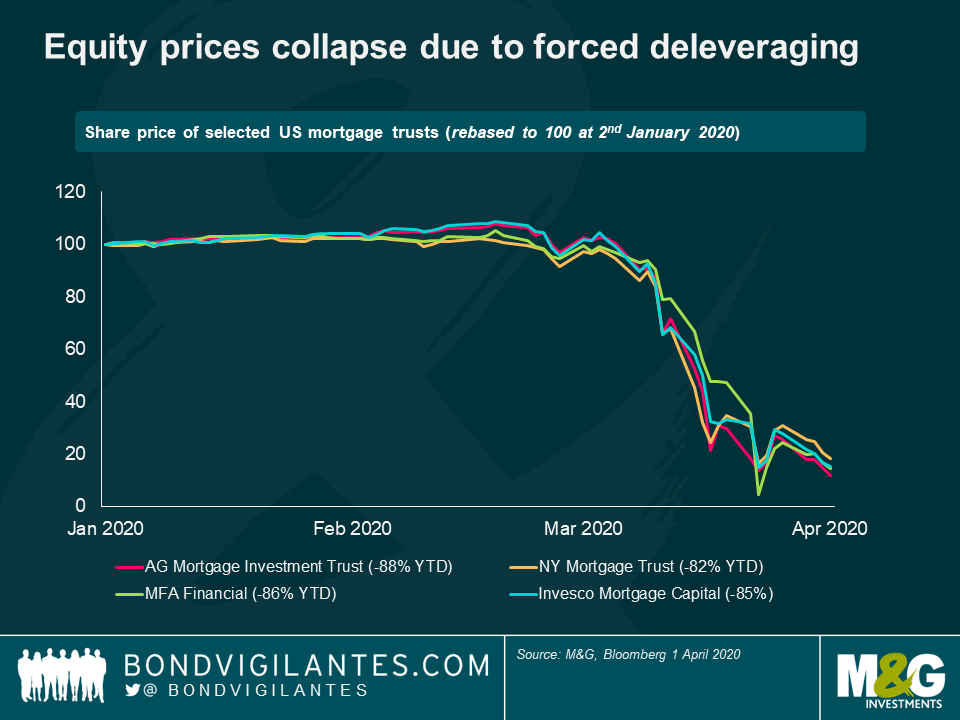
Over the weekend of 21st–22nd March, a number of publicly listed Mortgage Real Estate Investment Trusts (“REITs”) which invest primarily in non-Agency RMBS products all made public statements that they were no longer able to meet the continuing cash collateral calls for their repo lines and were seeking forbearance from their lenders. Public statements were issued by Angelo Gordon Mortgage Investment Trust, MFA Financial Inc., New York Mortgage Trust and Invesco Mortgage Capital Inc. amongst others. They have all seen significant falls in their share prices over the same period (see chart below). The associated liquidations created further downward pressure on prices in an illiquid market.
In response, and partly to remedy the increasing agency mortgage rates and provide much needed stability to the Agency RMBS market, the Fed announced an unprecedented unlimited purchase programme of Agency MBS. Unlimited – and they meant it. In the week commencing 23rd March 2020, the Fed purchased a staggering $183bn of Agency RMBS, an average of nearly $37bn a day. To put this into context, the largest purchase of Agency RMBS ever in a single week period in 2009–2010 was $130bn. Other measures introduced by central banks to contain the stresses on the financial system brought about by the COVID-19 crisis, including the Fed’s second Term Asset Backed Securities Loan Facility (TALF), have also helped to improve market sentiment in non-mortgage Consumer ABS. So far however, no direct support for the non-Agency mortgage market or the levered investors in it has been provided.
Whilst the acute liquidity concerns across the broader market have eased in recent days, it is worth continuing to pay close attention to these dynamics. It is possible that forbearance will be granted to repo borrowers, and also possible that the Fed will broaden the scope of stimulus to cover the non-Agency RMBS markets. In the absence of either, we could see a downward spiral of technical selling pressure, and fundamental selling pressure caused by the unprecedented recent US Initial Jobless claims data leading in turn to further technical selling pressure from levered buyers. In these fearful situations, it will be the marginal bid that dictates the price, and those with committed capital should monitor the situation for buying opportunities.


Sign up to the Bond Vigilantes mailing list to ensure you never miss a great article from our expert Bloggers. We will email all new articles to your inbox, meaning you can stay on top of the world of Bonds.
I confirm that I would like to receive information about Bond Vigilantes and products and services from M&G Securities Limited.
We will use the email address and personal data you have shared with us to send you this information. For existing customers, submitting your contact details and requesting to receive this information from us, will replace any earlier choices you have made in respect of marketing information.
You can unsubscribe from marketing at any time, at which point we will not send any further marketing information to you, by selecting the unsubscribe link in all communications.