
2018: The end of the (QE) affair
Well, at last it has happened. Ten years after the global financial crisis began, we have reached a place where synchronised global economic growth is more than just a pipe dream and the prospect of central banks moving away from their extraordinary ultra-loose monetary policy stances of the last decade is finally a reality.
There has been much excitement in recent months about the robust and broad-based nature of global economic growth. However, this is not to gloss over the risks that remain. Chief among these is inflation (or the lack thereof). With the notable exception of the UK, where sterling post-Brexit referendum weakness has pushed the Consumer Prices Index as high as 3% in recent months (see box on Brexit), there have been more column inches devoted to softening than hardening inflation trends (see box on inflation).
A broadly rosy US outlook
Despite the solid performance of the US economy, inflation there has remained weak. Indeed, outgoing US Federal Reserve chair Janet Yellen has described 2017’s low inflation as a mystery. Bond investors are split into two camps: does this weakness reflect temporary factors, or is there something more structural going on? If it is the latter, the Federal Reserve should be worried as there is little that monetary policy can do to combat deflationary forces like globalisation, demographics and technology improvements.
I think the arguments suggesting that the recent low inflation numbers reflect transitory factors and some positive supply-side developments look valid. For example: the increase in healthcare costs following the introduction of Obamacare has been lower than expected, while the introduction of unlimited data plans by cell phone providers has shown up in the official statistics as a sharp decline in prices. Looking ahead to 2018, a tight labour market should foster wage growth, while the potential for lower corporate tax levels could encourage higher domestic and international investment.
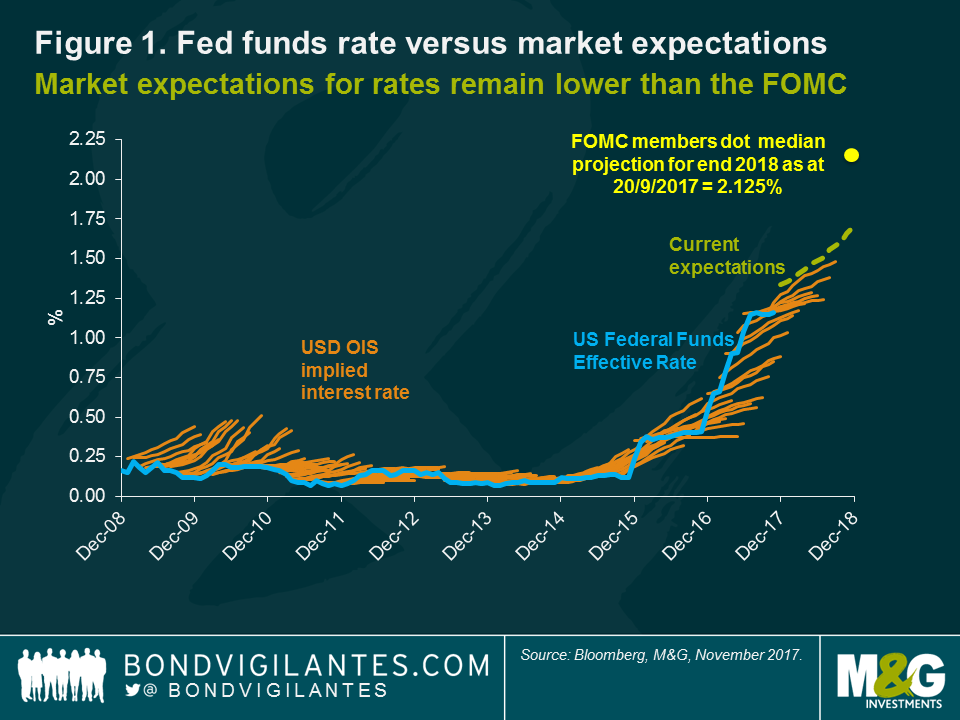
I expect the Federal Open Market Committee (FOMC) under new chairman Jerome Powell to continue to normalise rates gradually in 2018. Market pricing suggests a similar view, though expectations for the Fed Funds rate at the end of 2018 are around 50 basis points lower than the FOMC dot median projection would suggest (Figure 1).
The value of investments, and the income from them, will fall as well as rise and you may not get back the original amount you invested.
All change at the Fed?
President Trump confirmed in November that Jerome Powell will replace Janet Yellen as Chair of the Board of Governors of the Federal Reserve from February 2018. So what can we expect from the 16th chair of the Federal Reserve – the first non-economist to lead it since 1979? While Powell’s background differs from the norm, his policy stance is not expected to. The muted bond market reaction on the day of the announcement underlines his status as the status-quo pick. Had alternative candidates John Taylor or Kevin Warsh been appointed, the bond market may have sold off in anticipation of a more aggressive Fed hiking cycle and a faster QE taper than Yellen and the current Board – of which Powell forms part of – have implied. Indeed, 2017 marked Powell’s fifth year on the Board of Governors and in that time he has proven to be supportive of gradual interest rate hikes, voting consistently as part of the Yellen-led consensus.
Given Powell’s corporate background, however, it’s not a stretch to surmise that he may be more partial to lighter-touch financial regulation (something that Trump has long been an advocate of) than some of his predecessors. For example, with respect to the Volcker Rule (governing banks’ ability to speculate with retail deposits), Powell stated in a speech in October that “there’s a lot of room to address the burden” and that in terms of regulation “we can do it more efficiently”. This may have been noted by the market: since the announcement of Powell’s appointment, US swap spreads in the long end, though still negative, have moved back towards positive territory, suggesting that the market may have started to price in the prospect of an easier regulatory environment.
Positive surprises from Europe
Europe’s broad economic growth was the surprise of 2017. Many business activity indicators are near record highs, consumer confidence is very strong, and the third quarter’s growth rate (2.5% yoy) was the strongest for 10 years. Challenges remain, such as the level of bad debts in the Italian and Spanish banking systems, but even these are starting to show signs of improvement.
The European Central Bank (ECB) under Mario Draghi can rightly claim a significant contribution to this turnaround. Its extremely easy monetary policy stance has allowed the financial system to heal and has given businesses and consumers confidence to invest and spend. Importantly, the ECB has given guidance that it will retain a very easy monetary policy stance, announcing an extension of quantitative easing (QE) until September 2018, at a reduced level of €30 billion a month. As in the US, 2017 inflation levels have been stubbornly low, and there is currently little evidence of a return towards its target of close to, but below, 2.0%.
In November, the Bank of England’s Monetary Policy Committee (MPC) reversed its emergency rate cut undertaken in the wake of the Brexit referendum with what can be described as a “weak hike”. This may prove to be a one-off adjustment. The rate rise is difficult to justify given the continued political uncertainty that surrounds Brexit and the slow progress of UK-European Union (EU) negotiations. We expect to see more signs of slowing investment, falling consumer confidence and economic weakness unless a material agreement or transitional deal can be reached on the future UK-EU trading relationship – discussions on which can finally get underway after the two sides struck a last-minute deal on the first ‘divorce’ phase of negotiations in early December. The MPC, however, clearly has a different view and is worried that there is limited spare capacity in the economy that may lead to higher wages and above-target inflation. The good news is that this single rate rise of 25 basis points will have a limited effect on the real economy. Monetary policy remains highly accommodative, real interest rates are negative, and the Bank’s balance sheet is still large.
The world’s fourth-largest economy, Japan, is currently experiencing its second-longest economic expansion since World War II, having grown for seven successive quarters. As in Europe, the Bank of Japan is pursuing ultra-easy monetary policy and has committed to overshooting its 2% inflation target. As a result, it is unlikely that the Bank will alter its current stance of setting the short-term interest rate at -0.1% and 10-year Japanese government bonds at around 0%.
In China, the People’s Bank of China (PBoC) will look to mitigate systemic risks, suggesting a monetary policy tightening bias in 2018. The emphasis at 2017’s Party Congress (an event that occurs once in five years) on the quality of economic growth means continued policy efforts on leverage controls and tightening in the housing sector, which could weigh on public and housing investment. That said, growth looks to be becoming more self-sustaining, with robust consumption and external demand. I expect that China will continue to contribute meaningfully to both global as well as emerging market economic growth in 2018.
How high can rates go?
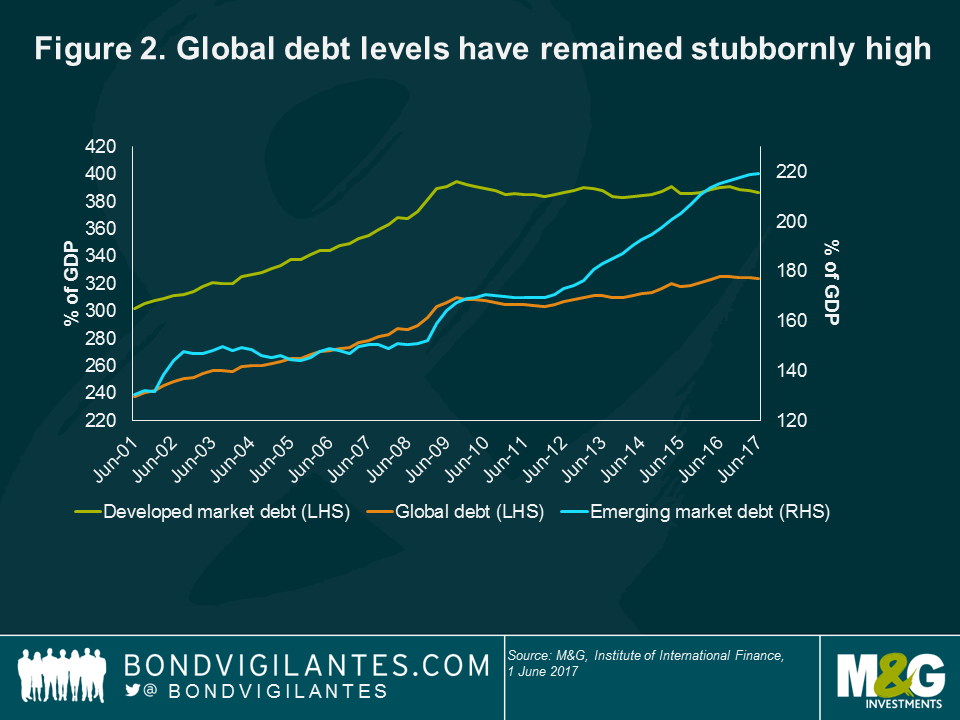
Many economists have attributed the slow pace of growth that we have seen during the economic recovery to a global deleveraging cycle aimed at reducing debt levels from what appeared to be unsustainable levels. So 10 years after the global financial crisis (as well as a European debt crisis and an oil crisis), where are we within this global deleveraging cycle?
Figure 2 shows global debt levels in recent years across the largest developed and emerging economies. After peaking in 2009, total debt levels declined slightly before rising once again to a level of 324% of world gross domestic product (GDP) today. It also shows that while we have been experiencing a mild deleveraging cycle in the developed world over the past 10 years (primarily due to deleveraging in the banking sector), most of the recent increase in global debt levels has come from emerging countries (Chinese state-owned enterprises being an important contributor, for example). This unabated increase in global debt levels means that – all else being equal – peak interest rates for this economic cycle in most developed countries are likely to be lower than they have been in the past.
Another key metric in the sustainability of global debt levels is the average interest rate paid on that debt. In this regard, the ultra-loose monetary policies that we have seen in most of the developed world have provided a bit of respite for many governments’ debt levels. Figure 3 shows that five years of nil or negative ECB deposit rates have significantly helped Europe’s ‘peripheral’ countries reduce the cost of servicing their public debt. Spain, for example, has been able to reduce the average coupon that it pays on its debt from about 4.5% three years ago to around 3.4% today.
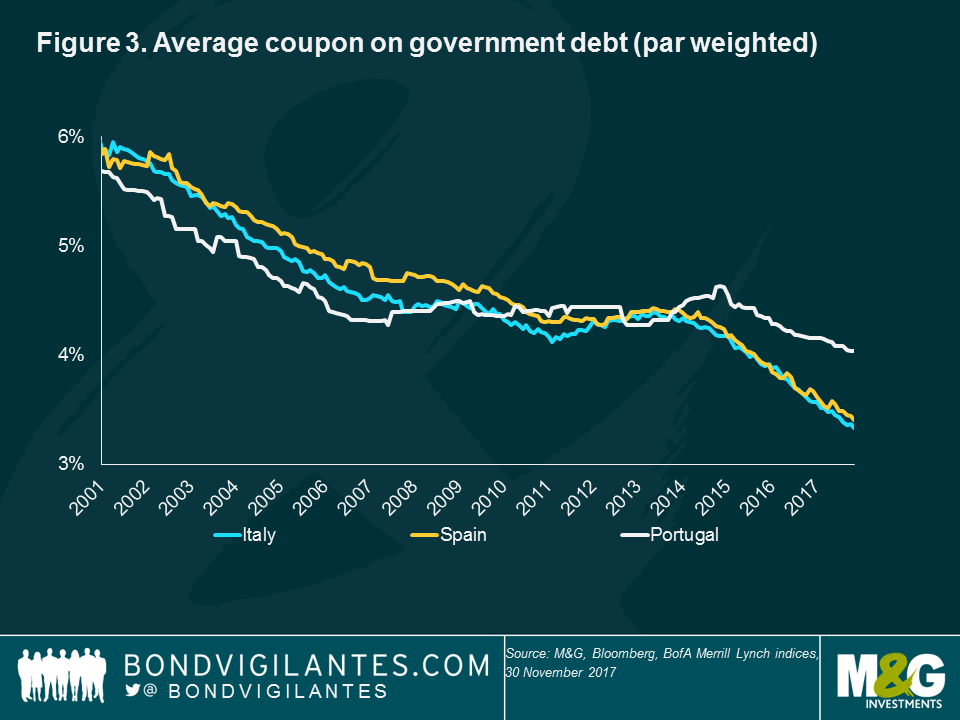
Assuming that the ECB’s QE programme will keep government bond yields low, we expect the cost of Spain’s debt to decline further during 2018. Its government has also taken advantage of low rates to increase the average maturity of its debt from 7.5 years in 2012 to around 9 years today – helping insulate it from future rate hikes or yield spikes.
Equally, the type of debt, such as fixed or floating rate coupons, must also be taken into account. The US household sector is arguably far less sensitive to higher interest rates than in the UK, as most mortgages in the US are priced off long-term fixed rates.
The fact that the Fed will need to keep raising rates to tighten monetary policy further is reflected in the adjustment that we have seen in 2017 in 2-year Treasury yields, which increased from 1.1% to around 1.8%. What is more surprising is that longer-term government yields have been extremely resilient: 10-year Treasury yields will end 2017 at around the same levels as they started. This combination of rising short-term yields and stable long-term yields has caused the US Treasury curve to flatten quite considerably in 2017 (Figure 4).
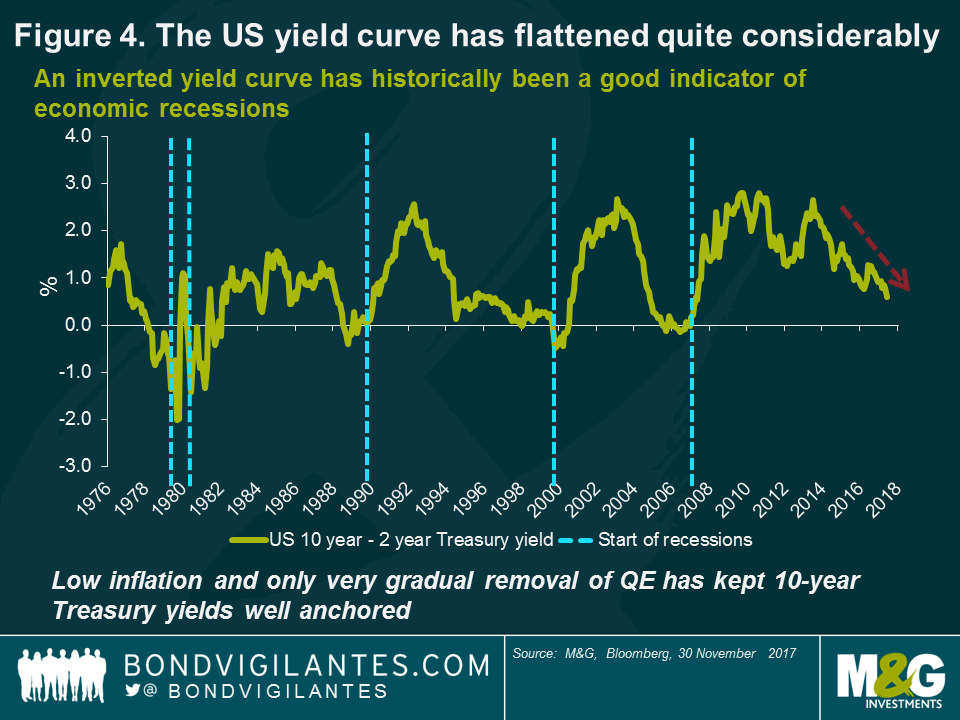
Historically, a flattening yield curve suggests an economic downturn (the yield curve inverted before each of the last seven US recessions). Given that the Fed could hike at least a couple more times in 2018, the curve could indeed become inverted if longer-term yields remain so well anchored.
So does the current shape of the yield curve signal an imminent recession in the US? Not necessarily. The persistent high demand for long-dated government bonds has been due at least in part to other important structural factors, such as slower productivity growth, lower inflation levels and an ageing world population. From a more technical perspective, the very gradual unwinding of the Fed’s balance sheet, the recent announcement from the US Treasury that it will sell more short-dated government bonds, and the purchase of longer-dated instruments by US corporations to pre-fund their pension liabilities in anticipation of tax reforms have probably also accelerated the recent yield curve flattening movement.
Given that these technical influences may lessen, and that the closing of the global output gap could also lead to higher inflation, we believe there could be downward pressures on long-dated US (or even UK or European) government bond prices in the months ahead. For these reasons, we continue to find many long-dated government bonds rather expensive at current levels.
The year of the great QE taper
It may be a continuation of the status-quo with a Powell-led Fed, but that doesn’t mean it’s more of the same. Balance sheet reduction and the great QE taper are set to take centre stage in 2018.Almost 10 years to the day of the onset of the global financial crisis, the Fed announced its process of balance sheet normalisation, committing to gradually reduce its balance sheet by US$10 billion per month (split 60/40 between US Treasuries and mortgages). From January 2018, the monthly reduction doubles to US$20 billion. The Fed-imposed limits will continue to increase every three months, until the total monthly reductions reach US$50 billion in Q4 2018.The technicals are changing. After years of central bank demand for Treasuries, 2018 is the first year in a long while when technical support for US Treasuries may waver, as net supply effects kick in (see chart).
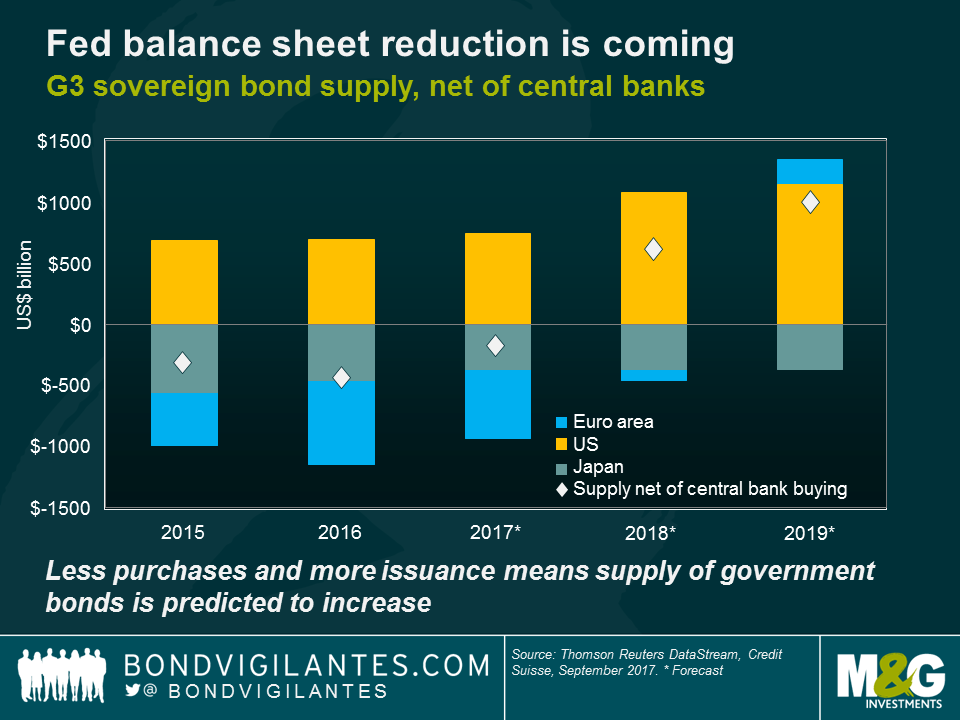
After years of shrinkage in net G3 government bond supply (net of central bank QE purchases), QE tapering by both the Fed and the ECB means that 2018 will likely see more sellers than buyers of G3 government bonds. The implications are clear: the days of record low government bond yields may well be behind us. If QE reduced government bond yields on the way in, the opposite may well prove true on the way out.
Beware credit quality
The quality of investment grade credit has seen significant deterioration in recent years. This has partly been voluntary, with companies believing that adding leverage to their balance sheets can enhance equity returns, but it also reflects the wider-scale credit downgrades that banks and financial institutions in particular experienced during and after the credit crisis. In 2000, for example, the US credit market contained a little over 30% in BBB rated securities (and the nascent eurozone credit market just under 10%). This has risen significantly since the start of the millennium, to the extent that global credit markets are now almost 45% exposed to BBB rated issuers, and this is trending higher. As a result, today’s global credit market has a far riskier credit profile than a decade earlier.
This is particularly important in the context of today’s credit spread levels. If you were to look at the overall global investment grade universe spread level in isolation, you could be tempted to think that despite the rally in corporate bond prices in recent years, valuations are simply back to their long-term average. However, when you take the aforementioned deterioration in credit quality into account, the picture is less rosy. It suggests that global credit is now into expensive territory rather than fair value. Of course, some of the reasons that have caused this are valid: ECB bond-buying, still-low default rates and continued demand for income-producing assets.
In high yield, it remains an issuer’s market, with bondholders’ rights suffering further degradation over the course of the year. According to Moody’s, so-called HY-lite (bonds that lack fundamental investor protection) levels have been rising steadily in Europe since 2013, from a level of well below 10% to around one third of all bonds coming to market today.
There are few immediate warning signs, as companies still benefit from a favourable macroeconomic environment, in a world of synchronised global growth and benign financial conditions. Companies can continue to benefit from cheap refinancing conditions for the foreseeable future.
Nevertheless, to my mind, deteriorating credit quality, and lower rewards for taking risk have made credit (both investment grade and high yield) a far less attractive asset class in 2017 than in previous years. For these reasons, I have reduced my overall exposure to corporate bonds this year, although as ever, I will monitor the market closely going into 2018 for better buying levels.
Emerging markets: resilience and relative value
After a nervous start to 2017, President Trump-related concerns for emerging market (EM) investors have broadly eased – the difficulties of getting things done domestically has constrained the president’s ability to do as much internationally as he may have initially hinted at. And in the event, sentiment towards the emerging bond markets has held up well in 2017. Optimism over improving (and synchronised) global economic growth has played a part here, as have firmer trends in commodity prices and China’s better-than-expected performance.
In addition, some topical risks started being ‘priced out’ of the emerging bond markets as the year progressed, including developed market political risks and worst-case scenarios in US/China relations (the US has not named China as a currency manipulator or embarked on a trade war).
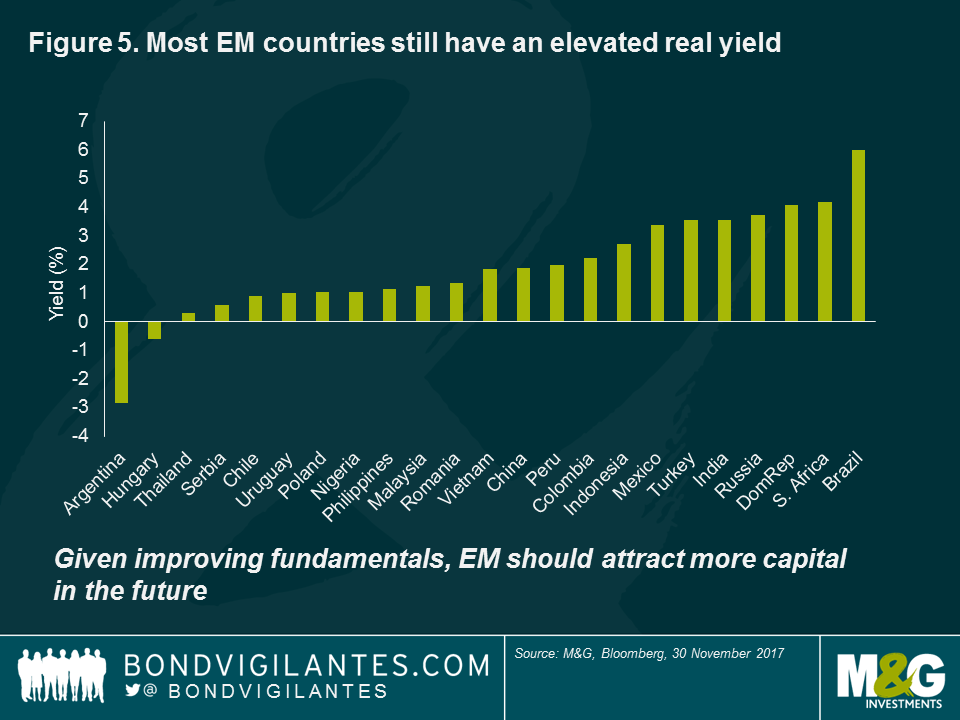
Emerging market fundamentals and valuations still look selectively attractive versus developed markets. Growth rates in many emerging economies exceed those in the developed world, for instance, while many also boast far lower debt-to-GDP ratios. Yields on both local and hard currency emerging market sovereign debt comfortably outstrip those on developed market government bonds.
As Figure 5 shows, high real yields underline the appeal in regions such as Latin America, where inflation is expected to fall in several larger markets, including Brazil and Mexico. However, I do remain concerned about the scale of China’s debt and, although a ‘hard landing’ is unlikely, we believe that tight spreads in the country’s bond market do not properly compensate for the risks.
More generally, the implications of higher US interest rates still need close attention. However, for many EM economies, the higher US rate environment is less challenging than in previous cycles, due to improvements in their current accounts, and lower overall levels of US dollar-denominated debt. That said, US rate increases could pose a headwind for certain emerging economies, particularly those more dependent on US dollar funding.
Absent the Fed falling behind the curve, my view is that EM debt markets can withstand slow and gradual US monetary tightening. Their high real yields should provide something of a cushion against further US hikes. A strengthening global economic outlook, meanwhile, also has favourable implications for the credit quality of EM bond issuers, as EM credit ratings actions typically correlate with growth rates.
Inflation: still missing in action
The lack of inflation in the global economy (with the current exception of the UK for Brexit-specific reasons) despite near-record levels of employment in much of the developed world remains one of the great puzzles of the post-financial crisis world. Conventional economic theory suggests that a shortage of labour will drive up wages as companies compete for the dwindling supply of workers, in turn fuelling higher inflation. But there is little sign of this happening just yet.
Of course this is not a new phenomenon, with global inflation having been on a downward trajectory for the past couple of decades. Many theories have been put forward to explain this trend. An increasingly open global economy has undoubtedly had a major impact, with the availability of cheaper goods and services from China and other emerging markets helping to keep consumer prices lower. Another key theme centres around advances in technology and artificial intelligence. As well as driving down the costs of production, increased automation may also reduce the demand for human labour, potentially keeping wages lower.
The rise of the so-called gig economy – the part of the labour market consisting of short-term or temporary jobs – is another important trend which has been attracting a lot of attention in recent years. With uncertain working hours and limited rights compared to permanent employees, gig economy workers will typically have very little bargaining power when it comes to setting wages. The prospect of a 1970s style wage-price spiral – where heavily unionised workforces secure ever higher wage settlements – looks remote in this context.
Brexit: Economic as well as political uncertainty
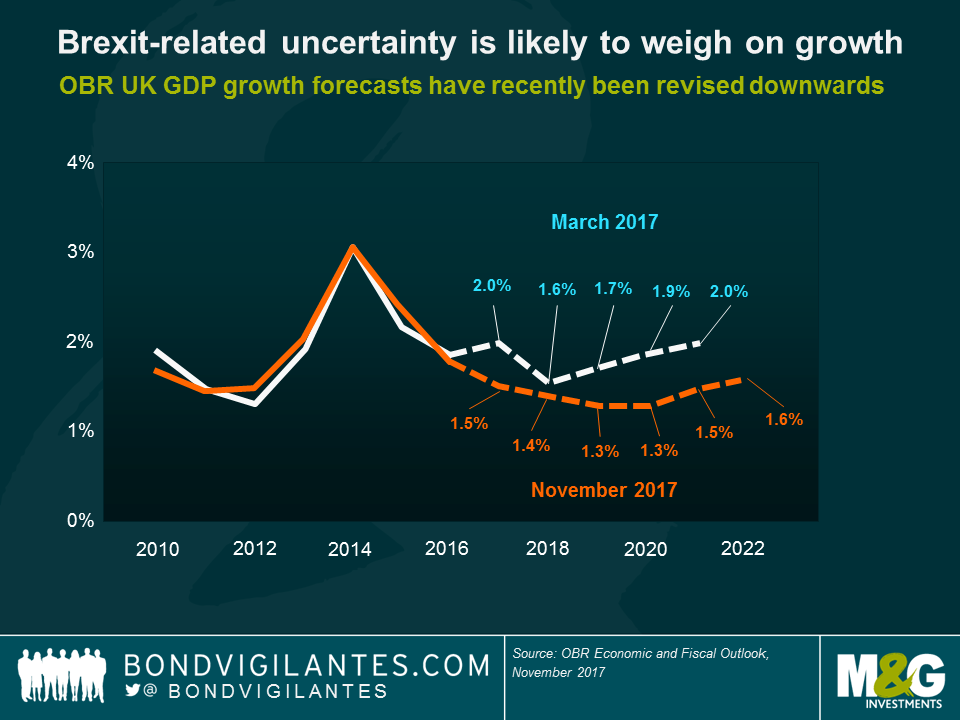
While the politics surrounding Brexit has never been far from the headlines in 2017, something that has perhaps fallen under the radar is the economics. After the referendum, the UK economy initially surprised both economists and the market, with growth and consumer data staying robust into the end of 2016.However, the most recent Office for Budget Responsibility (OBR) forecasts make for dire reading. Where previously the OBR was expecting growth to hit a low in 2018 and pick up gradually thereafter, the figures published in November 2017 now project growth downgrades to all five years of the forecast period, with growth bottoming out two years later in 2020. Either way, gone are the days of 2% annual growth rates.
The growth downgrades come largely from the OBR’s revision to its productivity forecasts. After years of overestimating growth, assuming productivity would return to pre-global financial crisis annual trend growth rates of around 2%, this assumption has now been halved, with productivity growth now expected to average closer to 1% (adding a cumulative £91 billion to the forecast for public net sector net borrowing over the next five years).This adjustment makes no assumption of the ultimate UK Brexit deal, however, and with changing demographics and a shrinking working population, it’s entirely possible that these productivity downgrades may still prove too optimistic. Should the economy disappoint – or Brexit start to bite – the UK may have no choice but to relax its fiscal austerity stance, bringing the focus back to the UK’s credit rating (currently AA), debt burden and currency once again.
More than one-third of the way through the Brexit negotiation period, the two sides have finally limped to an agreement on the first phase of negotiations – the ‘divorce’ settlement. Now all eyes will turn to the status of the future trading relationship. Despite the still-uncertain outlook, one thing is becoming clearer: the fundamental outlook for the UK economy is not looking pretty.
This information is not an offer or solicitation of an offer for the purchase of shares in any of M&G’s funds. Distribution of this document in or from Switzerland is not permissible with the exception of the distribution to Qualified Investors according to the Swiss Collective Investment Schemes Act, the Swiss Collective Investment Schemes Ordinance and the respective Circular issued by the Swiss supervisory authority (“Qualified Investors”). Supplied for the use by the initial recipient (provided it is a Qualified Investor) only. In Hong Kong, this financial promotion is issued by M&G Investments (Hong Kong) Limited, Office: 16/F, Man Yee Building, 68 Des Voeux Road, Central Hong Kong; in Switzerland, by M&G International Investments Switzerland AG, Talstrasse 66, 8001 Zurich, authorised and regulated by the Swiss Federal Financial Market Supervisory Authority; in the UK, by M&G Securities Limited (registered in England, No. 90776) and, elsewhere, by M&G International Investments Ltd (registered in England, No. 4134655). Both M&G Securities Limited and M&G International Investments Ltd are authorised and regulated by the Financial Conduct Authority in the UK and have their registered offices at Laurence Pountney Hill, London EC4R 0HH. M&G International Investments Ltd also has a branch located in France, 6 rue Lamennais, Paris 75008, registered on the Trade Register of Paris, No. 499 832 400 and a branch in Spain, with corporate domicile at Calle Fortuny, 6 – 4º A, 28010, Madrid registered with the Commercial Registry of Madrid under Volume 32.573, sheet 30, page M-586297, inscription 1, CIF W8264591B and registered with the CNMV under the number 79. For Hong Kong only: If you have any questions about this financial promotion please contact M&G Investments (Hong Kong) Limited. The Portuguese Securities Market Commission (Comissão do Mercado de Valores Mobiliários, the “CMVM”) has received a passporting notification under Directive 2009/65/EC of the European Parliament and of the Council and the Commission Regulation (EU) 584/2010 enabling the fund to be distributed to the public in Portugal. M&G International Limited is duly passported into Portugal to provide certain investment services in such jurisdiction on a cross-border basis and is registered for such purposes with the CMVM and is therefore authorised to conduct the marketing (comercialização) of funds in Portugal. For Singapore: for Investment Professionals and Institutional Investors only.
The value of investments will fluctuate, which will cause prices to fall as well as rise and you may not get back the original amount you invested. Past performance is not a guide to future performance.
17 years of comment
Discover historical blogs from our extensive archive with our Blast from the past feature. View the most popular blogs posted this month - 5, 10 or 15 years ago!


Bond Vigilantes
Get Bond Vigilantes updates straight to your inbox