
Panoramic Weekly: Markets, not Fed, go crazy
Global financial markets seemed to regain sanity over the past five trading days as they reverted to the typical negative correlation usually seen between stocks and bonds: investors snapped up traditionally safer government debt as concerns on the effect of rising rates over corporate profits mounted, dragging down leading equity indices. This followed a period in early October in which both equity and bond prices sank, leading US President Trump to blame the Federal Reserve (Fed) for going crazy by lifting rates too soon, hurting the economy – for more detail, watch “The Fed vs Trump – a tale from NY.”
Bond markets pared recent losses as US data continued to be unconvincing and despite a strong start of the US earnings season. Both inflation and the well-known Michigan consumer sentiment index came in below expectations, while the country’s budget deficit rose to $779bn in fiscal 2018, its widest since 2012. The Fed’s favourite measure of inflation expectations, the 5-year forward breakeven inflation rate, fell to 2.1%, still shy of recovering to the 2.2% level it lost in 2014 and which it has surpassed only once in May this year. The dollar fell.
Emerging Markets (EM) rallied, not only because of a weaker greenback, but also on their own account: Turkey released the US pastor, whose imprisonment helped trigger this summer’s EM crisis, and the lira surged strongly; it has now regained almost half of the value it lost in July and August; the same can be said for the South African rand, which surged following the appointment of a new finance minister. The Brazilian real has managed to completely wipe away its summer crash as the country prepares for the final round of its general election on Oct. 28 – both candidates are seen as fiscally responsible. Oil fell as the International Energy Agency cut its demand forecasts.
Heading up:
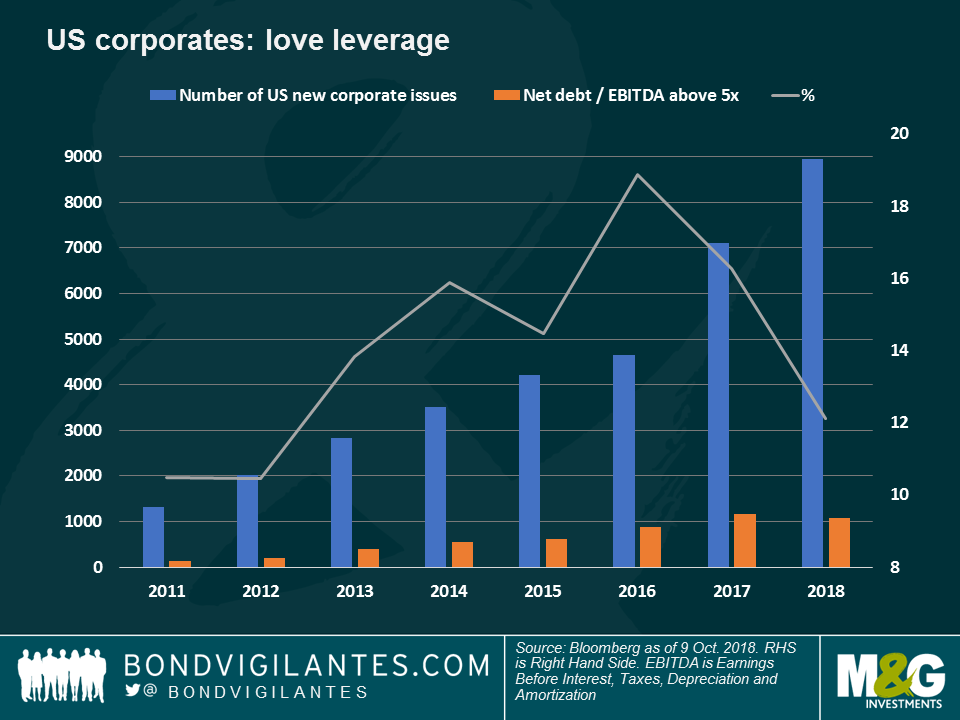
Debt binge – time of truth? Corporate debt has swollen in most developed countries over the past few years as companies have used record low interest rates to borrow more. Proceeds have been used not only to finance capital expenditures, but also to pay for stock-price enhancing actions, such as dividends and share buy-backs. As seen on the chart, the number of US new corporate debt issuers has steadily increased over the past few years (blue bars), as did the proportion of those issuers whose debt was more than 5 times’ profits (orange bars). However, this proportion started decreasing as the Fed initiated its present rate-rise cycle in December 2015 (grey line). Still, investors are increasingly nervous that the further hikes signalled by the Fed will dent corporate profits, reducing dividends and buy-backs – hence the recent equity sell-off. As detailed by M&G’s Lu Yu, corporate free cash flows could be seriously challenged only with a slight rate increase – for more detail, read Lu’s “Beware of the debt binge.”
British workers – Dancing Queen: When Britain’s Prime Minister Theresa May walked into the recent Conservative Party conference dancing to the tune of the famous Abba song, she had more reasons to cheer that she thought at the time: days later it emerged that UK average wage growth rose above expectations by 3.1% between June and August, while inflation remains soft: September’s Consumer Price Index (CPI) growth fell to 2.4% in September, after surging to an annualised 2.7% in August. Still, it is not clear yet whether Brits and their PM may not be turning to Waterloo soon: according to the European Union, chances of a no-deal Brexit are higher than ever.
Heading down:
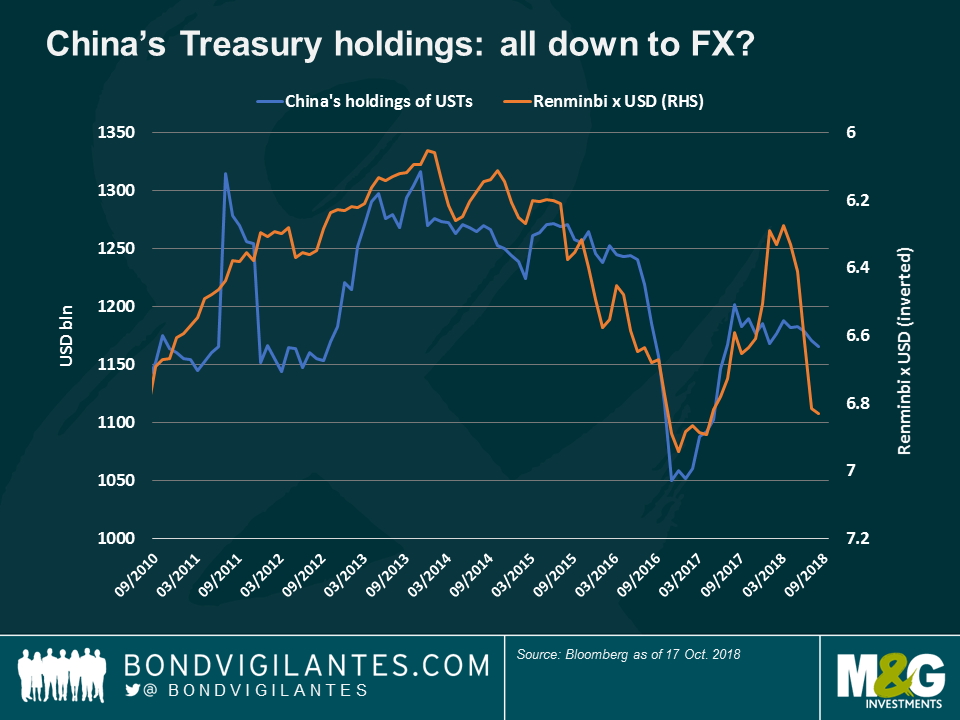
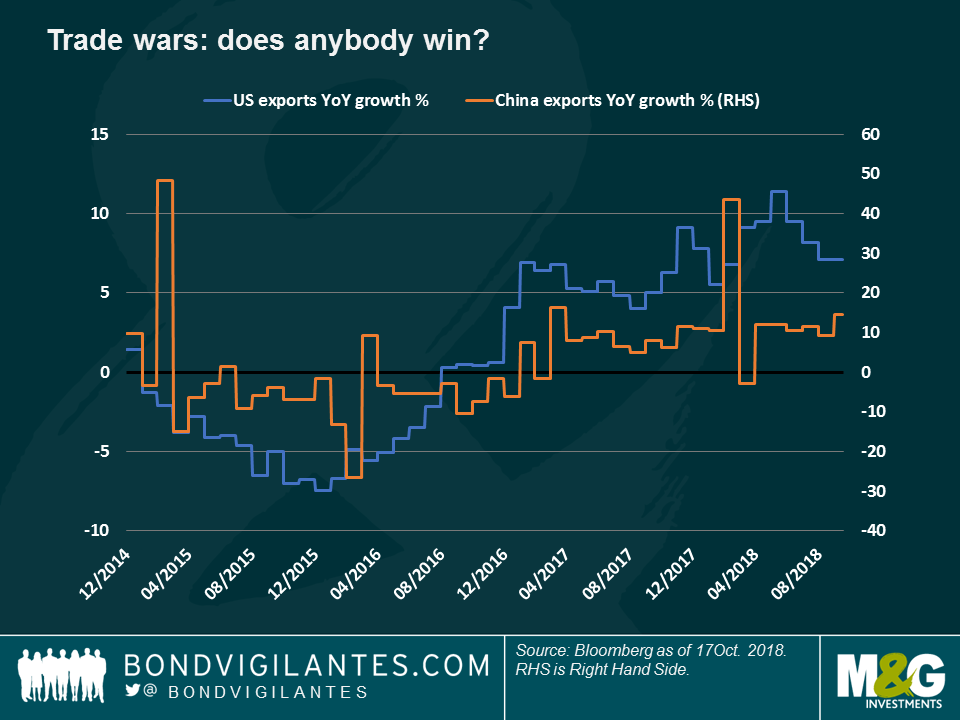
China’s Treasury holdings – sending a message? China, the largest holder of US Treasury debt after the Fed, cut its holdings for the third month in a row in August, this time by $5.9 bln, leaving its tally at $1.165 trillion. As seen on the chart, the world No. 2 economy’s holdings of the world No. 1 country’s debt has more or less matched the exchange rate between the two countries: China’s holdings fell in 2015-2016 (blue line) as the renminbi lost value against the dollar (orange). After a recovery in 2017 (as the dollar fell), China’s Treasury holdings are now falling again, albeit not at the same pace as the currency. At 6.92 units per dollar, the renminbi is just short of a low reached in late 2016, a level which has led Trump to accuse China of being a currency manipulator. The trade war between the two countries is still rattling markets and has already led the IMF to cut this year’s global growth forecast. It remains to be seen who will suffer more from it, the US, China, or both equally. For the moment, and as seen on the second chart, China’s exports are holding steady or going up, while the US’s are in decline.
High Yield supply – low: Non-Investment Grade-rated companies are holding off new issuance as rates rise, making corporate debt more expensive. New US high yield issuance so far in October has been particularly weak, leaving the amount raised year-to-date at $178 bn, the lowest since 2009. Tight supply has helped US HY deliver returns of 1.9% so far this year, beating its investment grade-rated peers, which have lost investors 3.1% over the same period. These outperformance has continued despite HY spreads reaching an 11-year low of 303 basis points (bps) over Treasuries in March this year. At 336 bps now, some argue that there is not much room for further tightening, while others say that positive fundamentals and technical factors such as short supply could sustain the asset class. For further insight, read M&G fund manager Stefan Isaacs’ recent blog “HY spreads: the story behind the story.”
The value of investments will fluctuate, which will cause prices to fall as well as rise and you may not get back the original amount you invested. Past performance is not a guide to future performance.
17 years of comment
Discover historical blogs from our extensive archive with our Blast from the past feature. View the most popular blogs posted this month - 5, 10 or 15 years ago!


Bond Vigilantes
Get Bond Vigilantes updates straight to your inbox