Markets
Gold prices: beyond inflation and real yields
By Robert Burrows
25 April 2024

UK CPI is now within a hair’s breadth of requiring a letter to the Chancellor. RPI increased to 3.9% from 3.6%, which was also above expectations. The increased fuel prices were expected this month, but August is also a high inflation month given transport price hikes that take place as people head away for their holidays, and as clothing and footwear prices are hiked with the new season’s collections coming to shop shelves.
But it seems likely that we are close, now, to peak inflation in the UK. Given this, I feel that the MPC should look through any headlines this week and stay their course, given concerns around the outlook for the consumer, and enormous uncertainty about the post March 2019 economy. That being said, I believe that the risks of a 6-3 vote have risen materially on the back of this number, as Andy Haldane has been pretty explicit on his discomfort with present levels of inflation, even if they are due to currency weakness and imports.
Increased disagreement on the MPC will likely lead to some sterling strength, in the short term at least, and it could see some downward reaction in short dated breakevens. But if we are a month or so away from peak inflation, to hike rates, strengthen the pound and reduce breakevens would be overly myopic and pro-cyclical in my view. It seems likely to me that inflation and breakevens are going to start to slide back from here gradually anyway: why accelerate and exaggerate those moves by acting a month or two early?
Perhaps heightened disagreement and debate though is the right policy, especially when combined with at least a cursory discussion on the potential need to raise rates more aggressively than the market is pricing in? If you think inflation does fall back from here, then perhaps you remain bullish on rates and don’t expect the first hike to come in the middle of 2018 and the second hike to come at some point in the second half of 2019. If inflation doesn’t fall back for whatever reason (likely to be sterling weakness on account of Brexit debates), then you probably need to start bringing forward rate hikes and increasing their number. With 10 year gilt yields at 1%, though, the bond market remains firmly nervous on the economy and unconcerned about the risk of hikes at this highly uncertain moment in time.
The United States is fast approaching the point at which its indebtedness reaches its debt limit, which generally is approved by Congress without debate. Routinely in the past the debt ceiling would be raised, reflecting that it does not affect the amount of spending, but only makes sure the U.S. can pay for spending it is committed to whether by tax receipts or by borrowing. It is about ensuring the U.S. can pay its bills.
Well, by most estimates we are now three months or so away from the U.S. once again hitting its debt ceiling. In the event that Congress does not raise the limit, then the U.S. Treasury would have to default on its bond obligations, or immediately curtail payments to public programmes or employees, known as a partial government shut down. In the Summer of 2011, Republicans demanded that in order for the debt ceiling to be raised, spending would have to be cut and taxes rise no further. Democrats wanted to see higher spending funded by higher taxation, and so Congress could not agree to raise the debt ceiling.
The U.S. entered a debt issuance suspension period in May, and would have run out of funds on 2nd August 2011, at which point either the U.S. Treasury would default, or it would have had to cut spending drastically overnight seeing government employees and programmes losing funding with clearly disastrous impacts on aggregate demand. The debt ceiling passed votes at both houses at the eleventh hour, on 1st August, and the default was avoided.
Given how little appears to be being done by the present administration at the moment, one can be forgiven for thinking ‘here we go again’. The chart below shows that in recent sessions the cost of 3 month money to the Treasury has surpassed that of 6 month money, so the curve has inverted for the first time in a long time. The bond market is starting to worry about a partial and temporary shut-down once more.
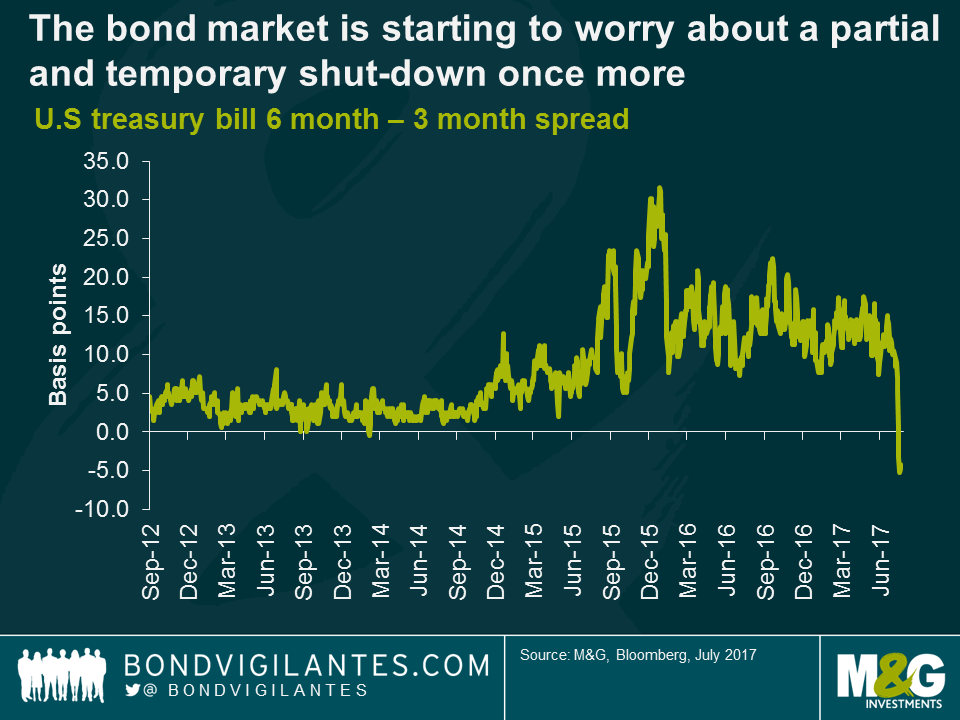
What should investors do then, if they are concerned about the debt ceiling not being raised and the U.S. is to find itself unable to pay its bills? Selling Treasuries might seem like the obvious trade, but it’s worth remembering that in the suspension period between April and August 2011, Treasury yields actually rallied. There was a period in late June and early July when default fears escalated and yields rose by approximately 40 basis points (c.4 point fall on the 10 year Treasury bond). This was soon reversed though, as concerns around a U.S. default brought a healthy dose of risk off to global markets, which saw Treasury yields continue to fall. A partial shutdown can’t be viewed positively for the U.S. economy, though, and if programmes are shut down and employees aren’t paid, then unemployment will rise, wages will fall, and aggregate demand will fall, which will put to bed fears of the U.S. economy overheating and further rate hikes being expected. So it’s a big issue. But the direction of Treasury yields and bond yields priced over them is highly uncertain, and indeed counterintuitive. Be careful.

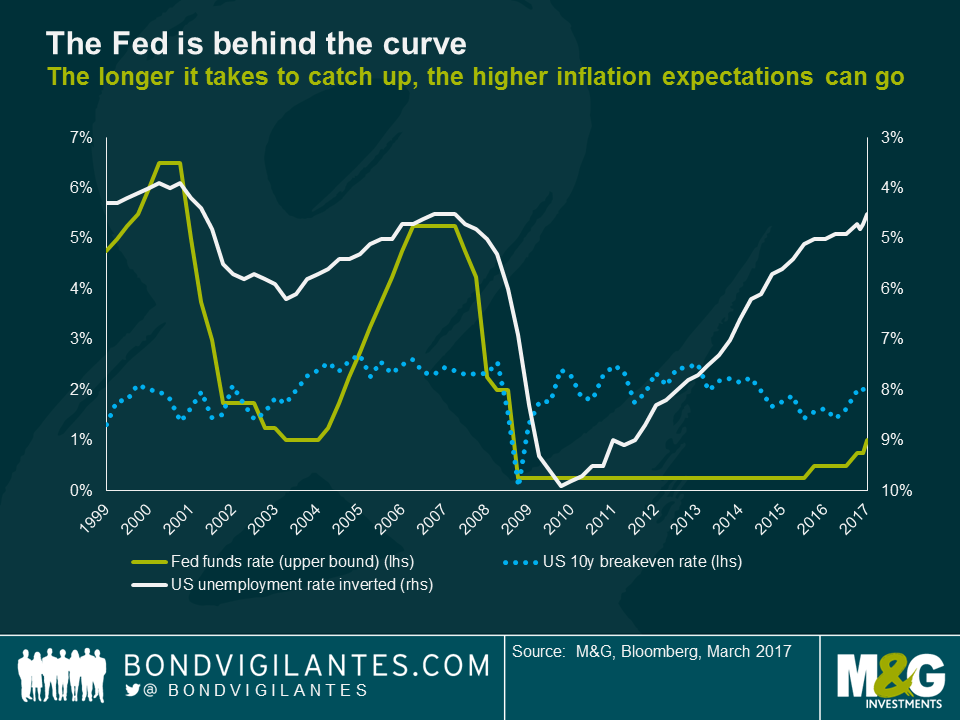
The last time the US had an unemployment rate below 5% and inflation expectations around 2%, the Fed funds rate was above 5% and had been aggressively hiked in the preceding period. Yellen’s Fed has been happy to let rates stay low amongst a tight and tightening labour market because wage growth has been lower than one would expect for a jobs market as healthy as this one. So, slow growth of wages must illustrate some underappreciated slack at work.
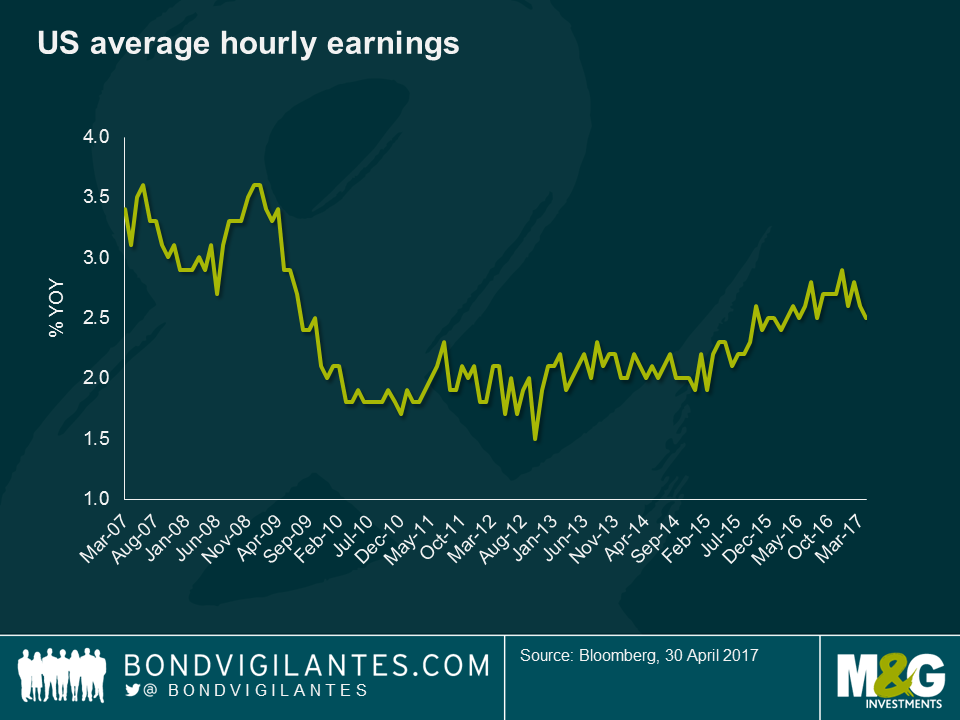
The monthly bell-weather of wages in the U.S. is average hourly earnings (AHE). This takes the aggregate wage growth of the US labour force and as the chart below shows has been curiously and worryingly (for central bankers) flat-lining in the years since the Great Financial Crisis. However, this measure does have a flaw that might lessen its signalling strength of labour market tightness: because it is an average of the aggregate wages of the US, it over-weights the higher paid minority of the population. Further, as younger people enter the workforce and older people retire from it, AHE would be biased lower, for example.
We have been watching the Atlanta Fed wage tracker recently, as a potentially better measure of wage growth given AHE’s biases. This measure is based on a matched micro sample of workers, whereby their wage growth is only measured if they were recorded in the same month a year ago. Thus, it avoids many of the compositional flaws of AHE. Furthermore, it is a median, rather than a mean, measure, which means that it will not over-weight the highest paid to the same extent as AHE. On top of this, the Atlanta Fed wage measure excludes the highest paid cohort from the measure. This is key today, because the highest paid have not been getting pay rises to anything like the same extent as the lower earners. Workers at Walmart, Home Depot, MacDonald’s and those citizens on minimum wages are those that are seeing the most significant wage increases. The Atlanta wage measure stands at a much healthier 3.4% today, having started 2016 at 2.2%, and shows clear signs of heading in an upward trajectory. For job movers, wages are rising at 4.1%. For workers of prime age, wages are rising at 3.8%, and for workers with a college degree, they are rising at 3.7%.
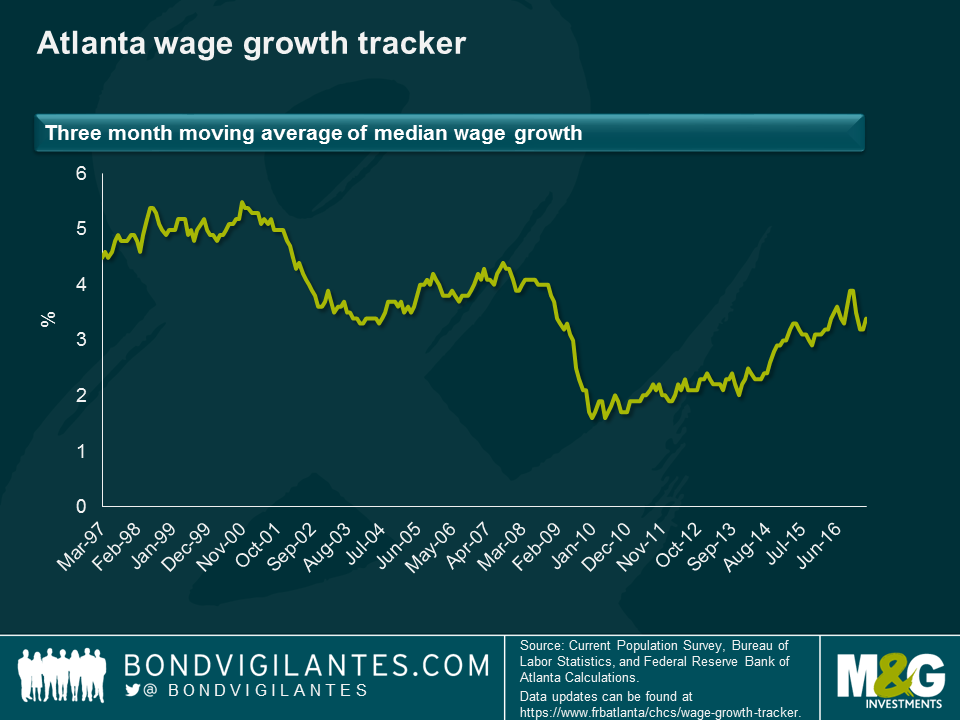
What growth rate of AHE would give the Fed confidence that the labour market is strong enough, and the outlook for consumption is strong enough, for the next series of hikes? We now know from experience that c.2.5% is not enough. But surely wage growth of more than 3% is? At 3.5% I would expect that the Fed has the confidence to signal an upward path of rate hikes. The point is, we are already there on one measure of wage growth, and we are probably only a few months away on the other, flawed but broader, one. Couple these tentative positive signs in wages with the fact that so much household debt is fixed, and the vast majority of it being fixed for more than 23 years (see this blog from earlier this year), and you can see why the Fed is content to press on with its hiking cycle.
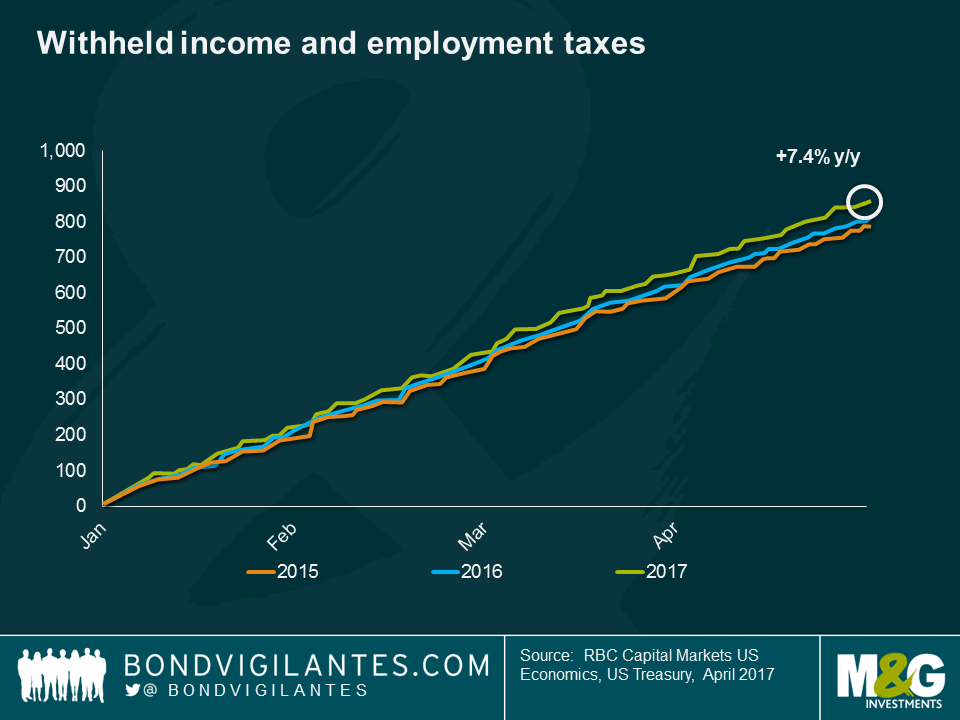
We need to acknowledge that both of these wage measures have flaws and biases. One data point that is being closely monitored by economists at Deutsche Bank and Royal Bank of Canada is withheld income and employment taxes. These are the amounts of tax taxed at source where employers send cash salaries net of taxes to staff and send the tax amounts to the authorities. This happens every day of the year, and so it does need smoothing to be applied. But Joe La Vorgna at Deutsche has long followed this data as it does not get revised and is obviously very timely. We have borrowed this last chart from Tom Porcelli at RBC, who came in to the office last week to give us his views. Currently withheld tax receipts are up 7.4% on the same point of 2016. Either more people are getting jobs, or people are being paid more. Or both.
In the UK, as of next month the official measure of consumer prices will become CPIH, with the H standing for housing. As at today, the only difference between CPI and CPIH is the inclusion of owner-occupied housing in the latter, on a rental equivalence basis (“how much would it cost to rent the home I own?”, a similar measure to the Owners’ Equivalent Rent component of US CPI), which has a weight of around 16%. So when rental inflation runs below CPI (as it did in 2009 and 2010), CPIH will tend to be lower than CPI, and vice versa. Recently, given the greater weighting of the residual (i.e. non-rent) items in CPI, falling food and energy items have had a larger downward impact on CPI than on CPIH. Interestingly though, over the longer-term, CPIH has tended to be approximately 0.15% lower than CPI.
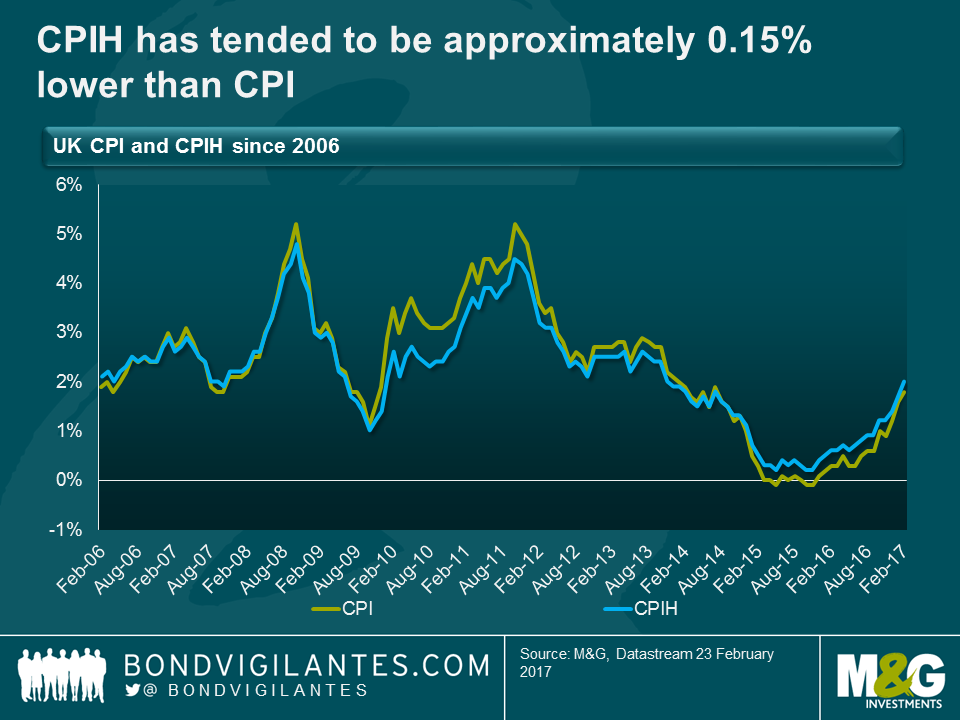
The different long – and short – term dynamics of the two indices has some interesting policy ramifications. Given that CPIH is now the preferred measure of consumer price inflation, it may well have future implications for the Bank of England’s price stability mandate (though it won’t automatically become the Bank’s target, the Chancellor could change this), as well as for the indexation of pensions and state benefits, and potentially for CPIH-linked gilt issuance. Remember that in the 2011 consultation on CPI linked gilts, one of the main objections to acceptance of such a programme was the uncertainty about CPI’s suitability given the lack of housing in the index. RPI, the measure on which existing UK index-linked gilts pay interest, does include a measure of housing cost (via a “depreciation” element and mortgage interest payments).
Over the long term, with CPIH expected to be circa 0.15% below CPI, one could argue that the BoE will find UK inflation (CPIH) even further below its desired 2% target (it’s unlikely, but not impossible that the inflation target would be lowered from 2% to 1.85% to reflect the typical wedge between the two measures). This might enable rates to stay lower for longer, or additional QE to be justified. A more hawkish reading might point to the UK’s housing scarcity and current pressures in the rental market as putting persistent upward pressure on CPIH, although perhaps surprisingly given the media coverage of the problems faced by Generation Rent, the official rental inflation number fell at the end of 2016 to equal its lowest reading since the series began in 1997, with year on year growth of just 1%.
1. We are at the point of peak oil pass through: January and February 2016 saw oil prices reach their lows ($34.25 Brent January 20th and $26.21 WTI, February 11th), so this week’s inflation numbers will see some high year-on-year oil price base effects, as will February’s. This is one of the main reasons why we have been seeing significant rises in inflation in recent months.
2. The upward march of inflation continues: US CPI was at 0% in September 2015, was less than 1% in July of last year, and is now back at 2.5%. European inflation was negative in May of last year, and this week approached the ECB’s target, at 1.8%. UK CPI was negative in October 2015, was less than 1% in October of last year, and this week reached 1.8%, only very narrowly below the Bank of England’s target.
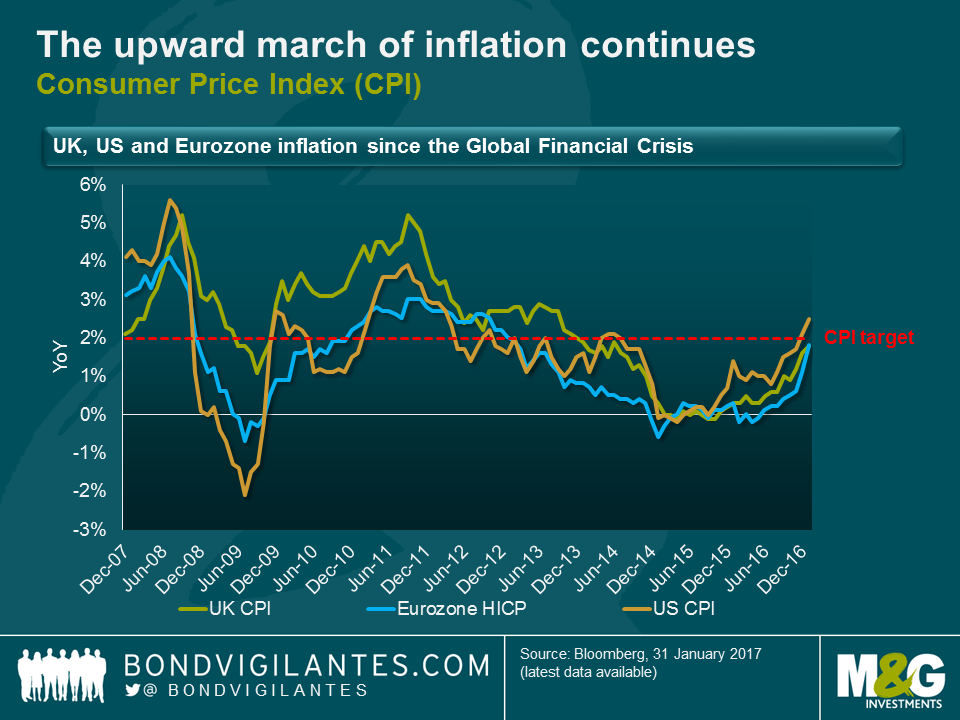
3. The UK was the only market to disappoint expectations this week, with 1.9% expected in CPI and 2.7% in RPI. However, most of the surprise came from significant falls in clothing and footwear. January sales discounting, which had been falling in recent years, increased meaningfully this year and caught consensus out. The items experiencing positive base effects (fuel, lubricants) and sterling depreciation pass-through (imported goods) were up strongly on the year.
4. UK inflation is actually back on target: well, at least on the National Statistician’s preferred measure of headline inflation it is. As of next month, in fact, CPIH will be the official headline measure of inflation in the UK (don’t worry, gilt linkers still reference RPI!). On this measure, UK inflation hit 2% this week. More on this shortly.
5. Breakeven valuations are no longer exceptionally cheap
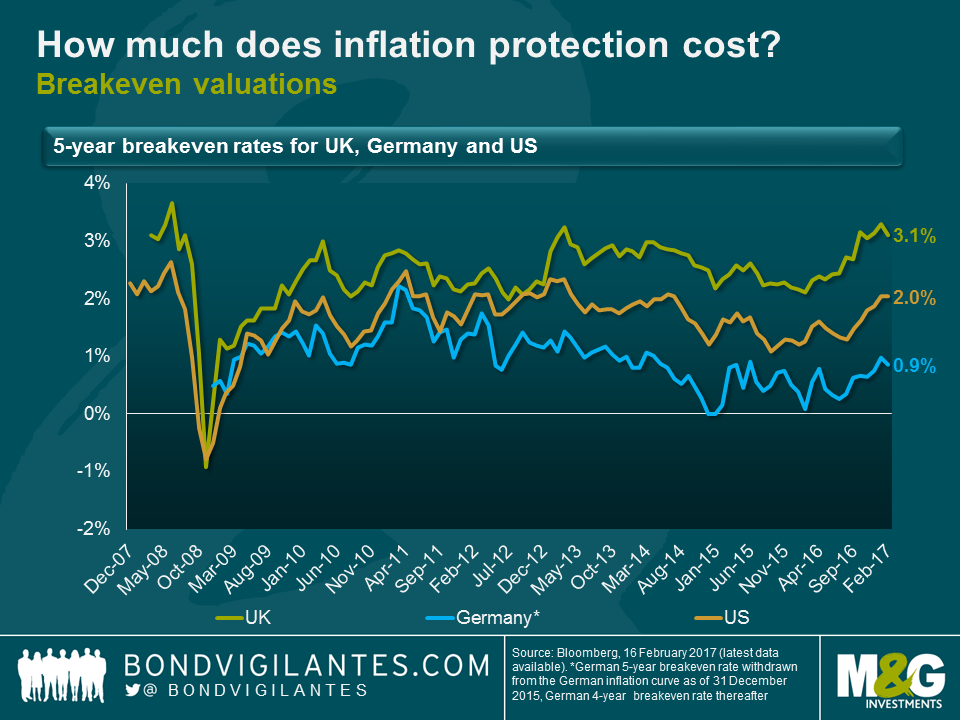
6. US: 2% across the curve for the first time since 2014 tells us the bond market expects the Fed to deliver CPI at 2% on average from this point on. In actual fact, I would argue this is still somewhat cheap, as the Fed targets the PCE deflator at 2%, and over the long term, for the PCE deflator to be at 2%, CPI would be closer to 2.5%. Nonetheless, the last twelve months have seen a big move in US breakevens.
7. UK: with breakevens between 3.1% at the front end and at near 3.6% at the long end, the recovery since the lows of the early parts of 2016 is as remarkable as in the case of the US. In fact, barring some aggressive assumptions about the RPI-CPI wedge, the UK market is priced for UK inflation to be above target, forever. I see value in short-dated breakevens, because oil and sterling weakness are going to see a period of significantly higher inflation than target. But quite what the market is seeing that makes these inflation overshoots look permanent remains to be seen and, to my mind, makes long end breakevens vulnerable.
8. Europe: breakevens have also recovered strongly in Europe as elsewhere, but remain significantly below pricing in the achievement of sustainably on target inflation. Perhaps the concern is that the recent strong HICP numbers will not persist past the oil price base effects? And that seems a reasonable concern to me.
We have come a long way in the last year in the inflation markets. The question from here, though, is whether we are going to see inflation fall back once we are past the peak oil base effects period, in the middle of 2017, or whether momentum and the reflation theme can be maintained. In the US, at least, it appears to me that the labour market and, in particular, wages are going to see momentum continue. As I recently blogged, given the significant differences between US and UK household debt, it looks to me as if the Fed is already well behind the curve, and may find it hard to catch up with it. The prevailing question for me remains whether this rising tide in the US will lift all boats, or whether European inflation and the long end of the UK market will sink back from current levels.
The cost of new mortgage borrowing and payments on outstanding household debt can have a large impact on the rate of growth of an economy. For this reason, central bankers are interested in the transmission mechanism of monetary policy. It has been shown that interest rates can have a stronger influence on an economy where there are a high proportion of variable rather than fixed-rate mortgages. Whilst there are well known differences in the mortgage markets of the US and UK in terms of the proportion of fixed versus variable mortgages, some interesting trends have developed post-financial crisis.
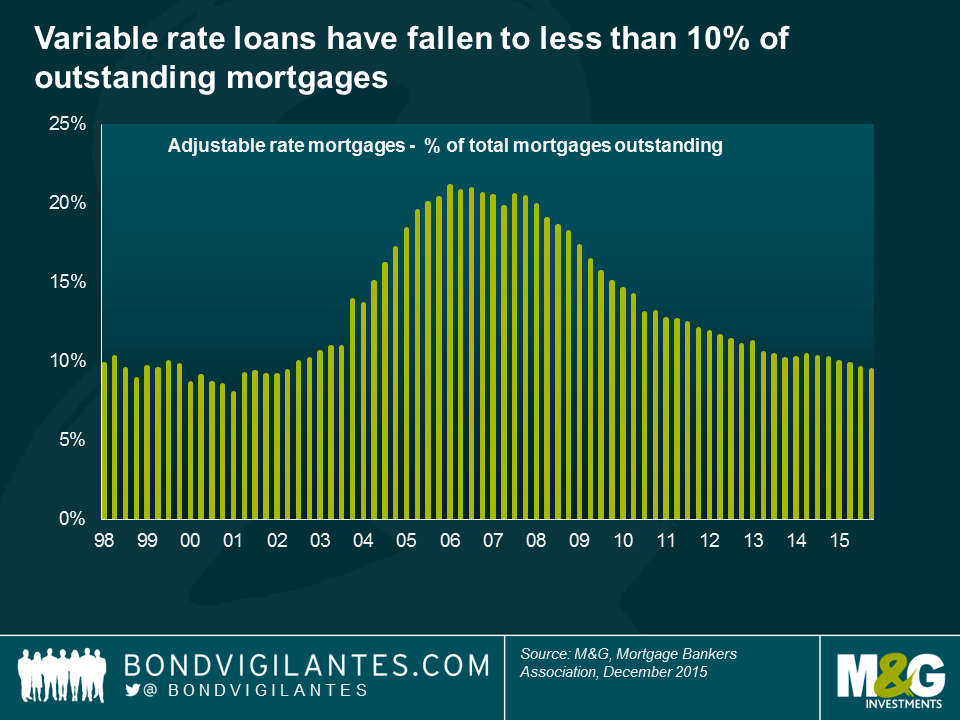
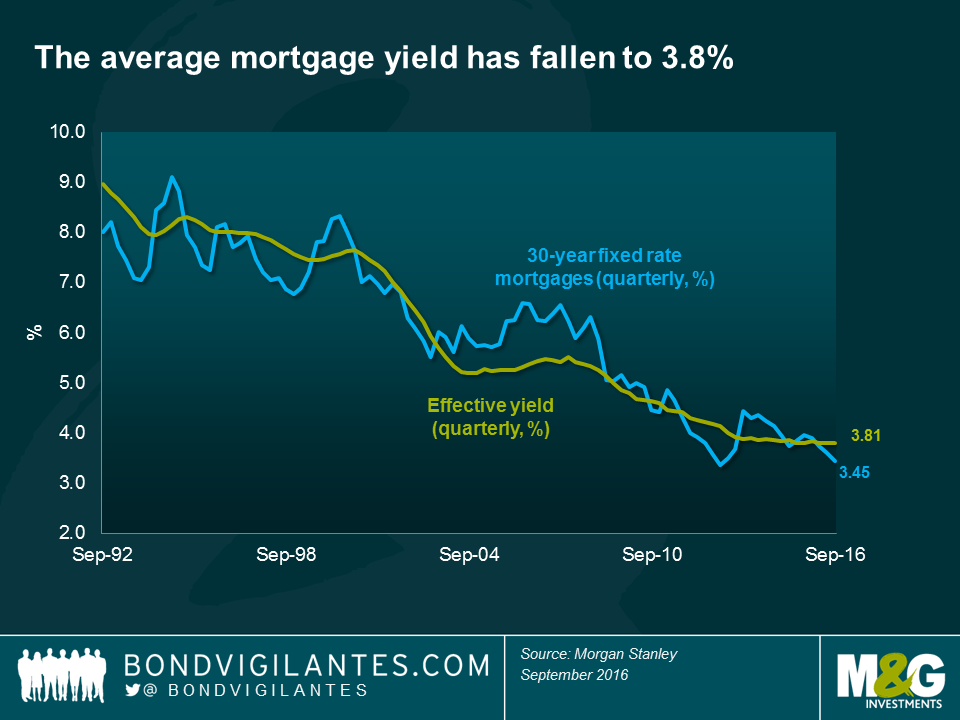
The US mortgage market is now more fixed rate in nature than it has been in a number of years, with variable rate loans falling from more than 20% of outstanding mortgages in 2005 to 2008, to less than 10% now. The average maturity of US mortgages is just over 23 years, owing to the dominance of 15 year and 30 year fixed rates mortgage products. The realised duration of US mortgages tends to be much shorter than this, as the loans are fully pre-payable. However, if we start to see higher yields and higher mortgage rates, these mortgages will be much longer dated than they have been in years.
Not only has the proportion of fixed mortgages been increasing, but the average mortgage yield has fallen to 3.8%, a level not seen before in the historic data. In essence this means that the average US mortgage borrower has a 23 year fixed rate mortgage on a rate of only 3.8%.
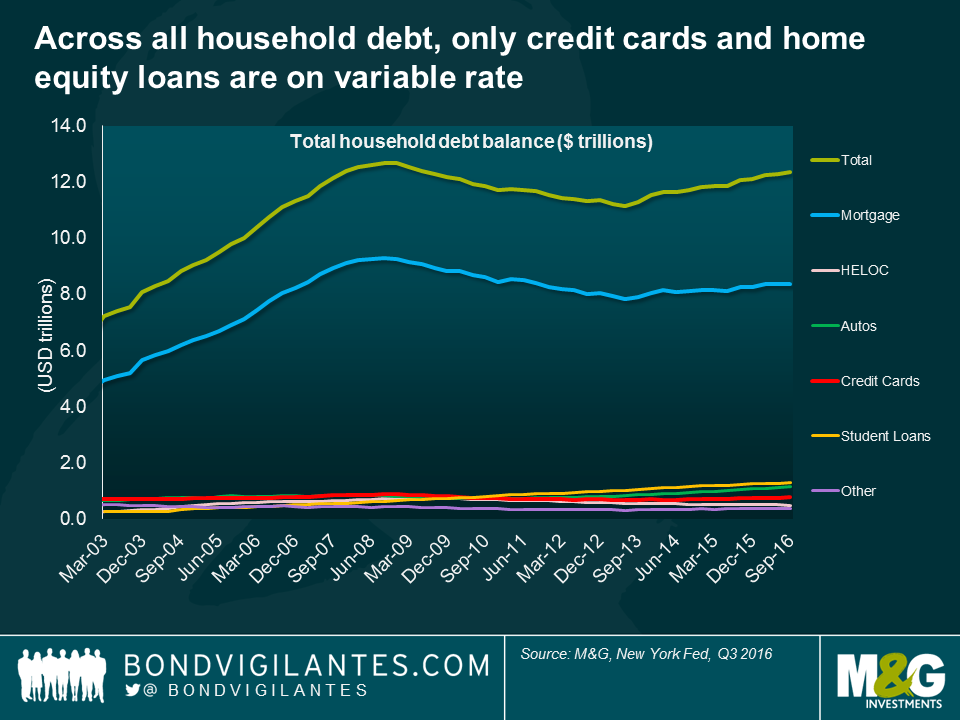
Taking it a step further, across all US household debt, it is only credit cards and perhaps home equity loans that are on variable rates. Thus around 90% of all household debt is on fixed rates. This long dated, fixed, and very low rate mortgage market has implications for the transmission mechanism of monetary policy in the US, meaning that the Fed Funds rate is a blunt tool to slow down the real economy as it takes a longer time for the force of higher interest rates to be felt.
In contrast, in an economy such as the UK that has a fewer proportion of fixed rate loans and much shorter dated fixed rates offered, monetary tightening would be felt much sooner, as the household sector sees more income directed towards servicing loans with less left over for spending. To draw out the contrast between the two mortgage markets, I’ve made some simple assumptions with regards to average house prices, salary etc. At first glance, if we assume 80% loan to value ratios in both markets and take average mortgage rates across both markets, it appears that the two markets require similar monthly payments of $481 versus £433 per month. However, as the simplified affordability measures suggest, this is misleading. As a proportion of the average monthly salary, the US borrower pays just 11% on mortgage payments, compared to 20% in the UK.
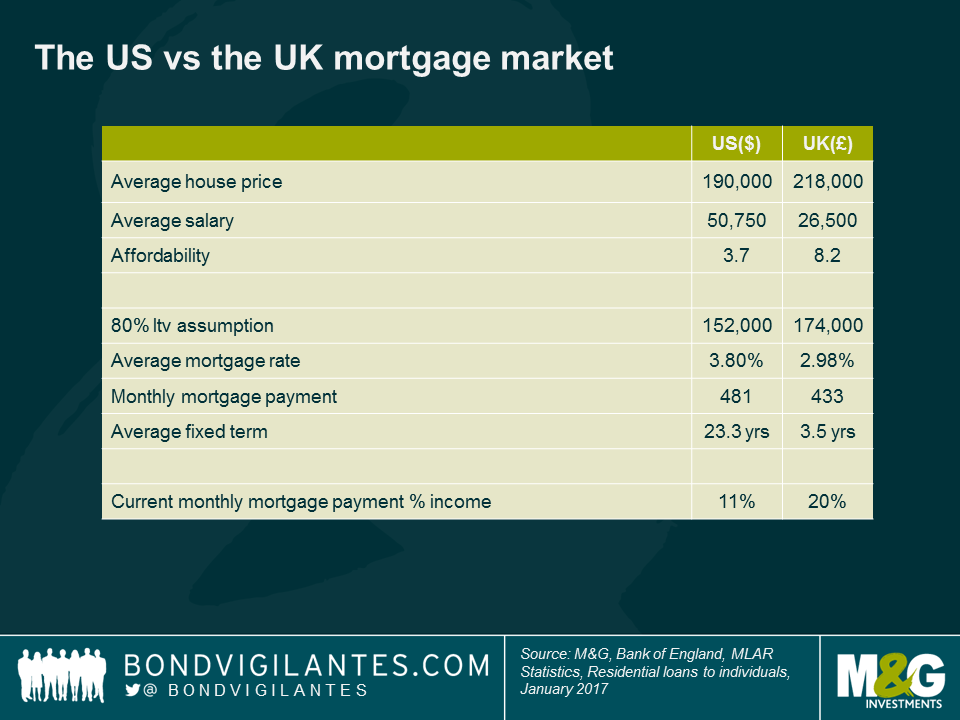
Arguably the biggest difference lies in the differing average mortgage terms, 23.3 years in the US versus 3.5 years in the UK market. The impact of this difference, on the monetary policy transmission mechanism, can be further investigated under the assumption of rising rates. To do so, I have assumed constant mortgage margins and a UK mortgage market with 50% variable rate and 50% fixed rates (with fixed mortgages split between 2 year and 5 year terms).
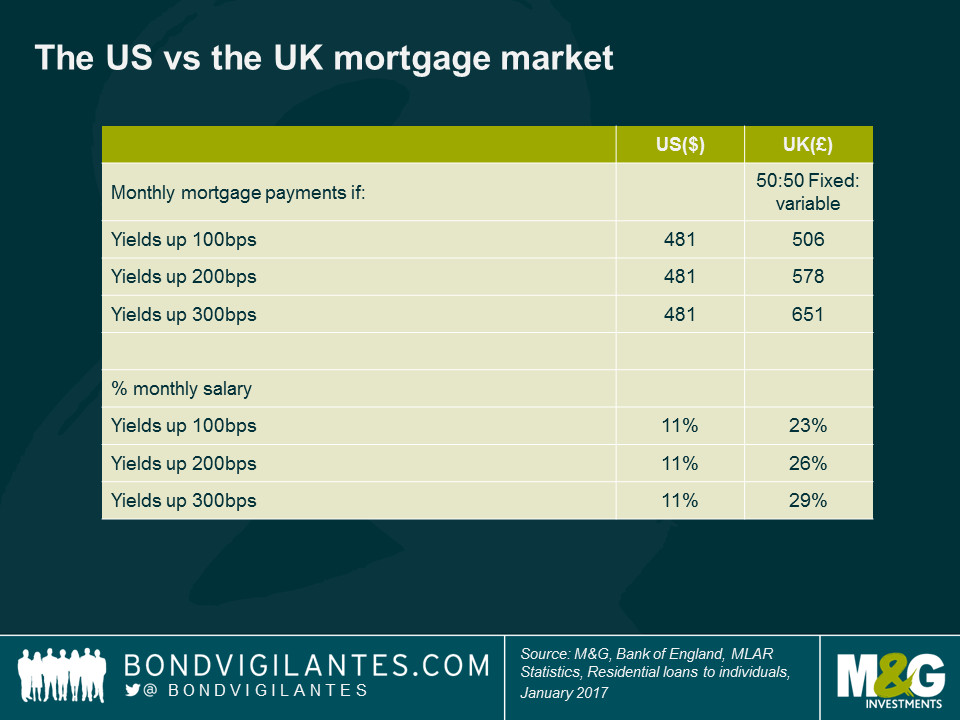
The benefits of fixed rates at low levels in the US are plain to see. For every 1% rise in mortgage rates, the average UK borrower sees 3% more of their monthly salary sucked in to servicing the debt.
In actuality, my assumptions have been generous to the UK market in two key areas. Firstly, I have assumed that the mortgage rate increases occur quickly, so that those on 2year or 5year fixed rate mortgages, stay fixed, rather than reaching the end of the fixed rate and resulting in borrowers having to either re-mortgage to prevailing fixed rates, or take the standard variable rate. And secondly, I have assumed that the variable rate is today the same as the average mortgage rate in the UK (2.98%). A quick search online shows that it is probably more like 4%, or higher.
Though this work has many assumptions and is therefore very subjective, the implications are nevertheless clear; the monetary mechanism and the potential ramifications on consumption differ widely between the two countries. Through UK rate tightening, demand and consumption would adjust relatively quickly. The US household sector at this point in time however is much less sensitive to rate moves, and rates may need to increase higher – or the monetary policy time lag may be considerably longer – than is currently priced in.
I have been overwhelmed by a sense of déjà vu of late. Talk of rates not rising again this cycle (US), ever again (Europe), or even being cut even further (UK, Japan) prevails. Quantitative easing continues apace and could be set to broaden further, be that in its duration or via the inclusion of new types of assets. Economic growth appears to be stalling, corporate profitability is showing late cycle declines, inflation remains practically non-existent. I could go on. Everywhere you look there is pessimism about the global economy, concern about monetary policy having – perhaps long ago – reached its limits, and new reasons to buy government bonds and risk free yields.
I was recently having a conversation with my colleague Anjulie about valuations and the outlook for government bonds, and in doing so, realised that I felt unnerving similarities between now and the first few months of 2013. Back then, there was talk about ‘QE-infinity’, the Japanification of the US, rates never being hiked again; anyone else see any parallels? Anjulie’s view, more correctly than mine, so far, was that despite yields already being historically low, given the extraordinary central bank action, the case could be made for rates and government bond yields creeping lower still. I felt differently, and said that it would be a worthwhile exercise for us to go and look back at the ‘Taper Tantrum’ and ‘Bund Tantrum’ of 2013 and 2015. Perhaps we could learn something from these episodes that could be applied to today? Anjulie put together the below slides and her findings are worth discussing.
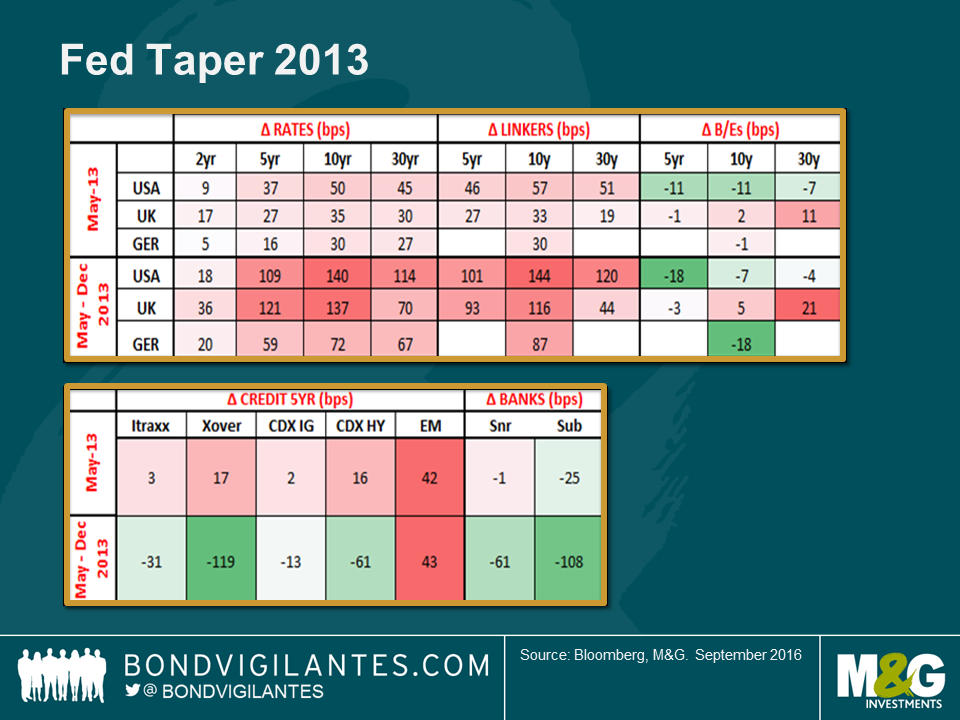
Following the insignificant comments made by Ben Bernanke in an afterthought to a speech in May 2013 (in which he referred to tapering off the rate of purchases of government bonds and mortgage backed securities; MBS), the bond market awoke and had a proper tantrum. As the chart shows, 10 year treasuries sold off by 50 basis points in May alone, and by 140 basis points in the eight month period May – December 2013. Bunds and gilts were dragged down with treasuries, in spite of the fact that there was no talk of ‘tapering’ in Europe and the UK. Index-linked bonds were hit too, in a resolutely negative manner. Credit, though, was more mixed, with an initial widening in credit spreads in May reversing very strongly by the end of 2013, except in emerging markets which took the utterance of the word taper downright negatively.
One word, taper, was enough to cause these massive moves in government bond yields. It wasn’t a change in policy, as rates didn’t move and the rate of QE purchases did not change. So we asked ourselves what actually drove the changes. In my opinion, the takeaway from this episode was that the “this time it’s different” arguments had hit fever pitch (i.e. arguments about why monetary policy was never going to reverse course, which had been used to justify positioning reaching extreme long levels in government bonds and fixed income generally). As the realisation dawned that zero rates and constant QE were not necessarily going to carry on forever, everyone rushed for the door, fast.
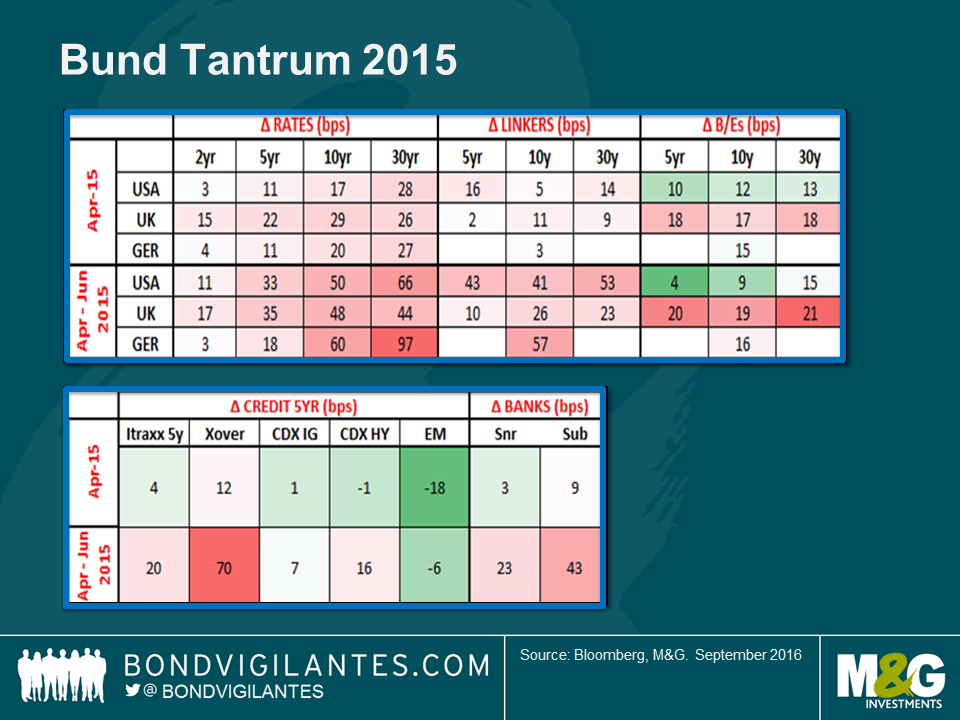
The bund tantrum of April 2015 was similar in that UK, German and US government bond yields all rose significantly, with bund yields up 20 basis points in April and by 60 basis points in the April to June period. The story in credit was much more mixed though, and it is difficult to draw anything from this period, other than to observe that bank bonds took rising yields to be starkly negative. How different it feels today!
Looking back at this tantrum it is hard to put one’s finger on the catalyst which caused sell off in government bond yields. Yields on 10 year bunds touched 0.1%, and two months later they were back at 1%, incurring a loss of around 9 percentage points. In this case, I would postulate that positioning had moved very long given negative inflation prints and the start of QE. At 0.1%, long term valuation considerations came back to the fore and investors started to sell. And then everyone did. Again, fast. Whatever the reason, the sell off serves as a stark reminder: sentiment can change suddenly without the need for an obvious trigger.
As I mentioned at the outset, I see many parallels between today and the periods preceding these sell-offs. “This time it’s different” arguments – how rates can’t rise, QE can’t stop, inflation can’t be seen anywhere on the horizon, and government bonds can’t fall in price – abound. These are being used as justifications for buying yields and duration, even at a time when starting valuations are at extremes. We saw the same in early 2013 and in the early parts of 2015, albeit the starting point for valuations in the build up to these two tantrums were not as extreme as they are today. Being aware of these similarities, and remaining fully aware of current valuations, to my mind, argues for caution in these times.
Now that the Bank of England has commenced purchases of gilts and committed to a programme of corporate bond buybacks, alongside similar measures being presently undertaken by the ECB, it is worth taking a step back and thinking about valuations in sterling fixed income.
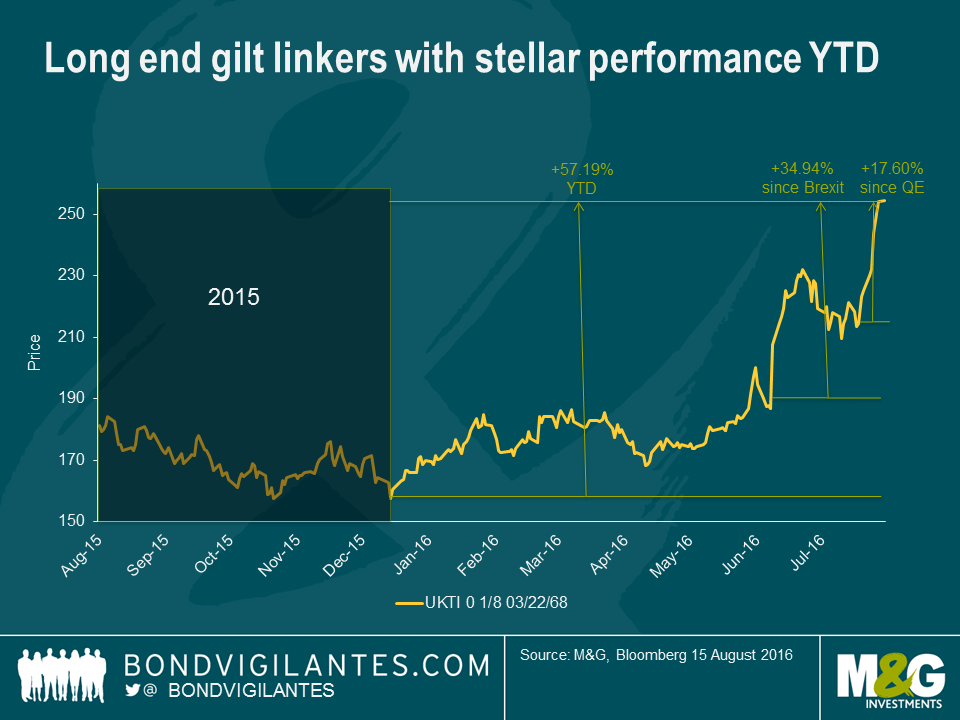
Let’s take a brief look at what has happened so far in 2016 in government bonds. The ultra-long conventional gilt has returned a staggering 52% this year. Since the result of the referendum became clear, the bond’s price has increased by 20%, and in the couple of weeks since Mark Carney announced the Bank of England’s stimulus package, the bond’s price has risen by a further 13%.

But this is not even the top performing government bond of 2016. That mantle goes to the 2068 index-linked gilt, which has seen its price rise by 57% year-to-date, by 35% since the vote to exit Europe, and by 18% since further quantitative easing was announced by the central bank. Interestingly, too, the superior price action of the index-linked bond has occurred not as a result of rising inflation or expectations of inflation; instead it has been in spite of significantly falling inflation expectations so far this year. The driver of the outperformance is solely due to the much longer duration of the linker. Its duration is 19 years longer than the nominal 2068 gilt, by virtue of its much lower coupon!
When you buy a corporate bond you don’t just buy exposure to government bond yields, you also buy exposure to credit risk, reflected in the credit spread. The sterling investment grade sector has a duration of almost 10 years, so you are taking exposure to the 10 year gilt, which has a yield today of circa 0.5%. If we divide the yield by the bond’s duration, we get a breakeven yield number, or the yield rise that an investor can tolerate before they would be better off in cash. At the moment, as set out above, the yield rise that an investor in a 10 year gilt (with 9 year’s duration) can tolerate is around 6 basis points (0.5% / 9 years duration). Given that gilt yields are at all-time lows, so is the yield rise an investor can take before they would be better off in cash.
We can perform the same analysis on credit spreads: if the average credit spread for sterling investment grade credit is 200 basis points and the average duration of the market is 10 years, then an investor can tolerate spread widening of 20 basis points before they would be better off in cash. When we combine both of these breakeven figures, we have the yield rise, in basis points, that an investor in the average corporate bond or index can take before they should have been in cash.
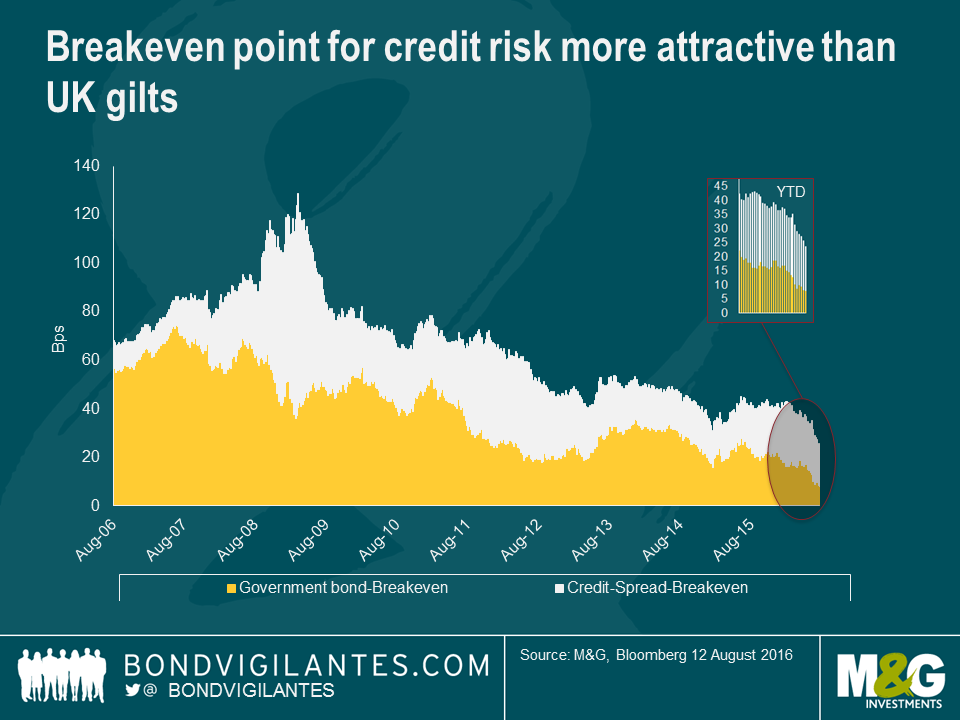
With very low gilt yields and credit spreads that are being supported by coming central bank buying, accommodative policy and low defaults, and a benign consumption environment, it is no surprise that corporate bond yield breakevens are at the lowest level we have gathered data for. It is for these same reasons that the typical in-built hedge characteristic of a corporate bond or fund is at such low levels. Traditionally, if the economy is strong then credit spreads tighten whilst government bond yields sell off, such as in 2006 and 2007. And if the economy enters recession, then credit spreads widen and risk free government bond yields rally, such as seen in 2008 and 2009.
With the Bank of England buying gilts and soon to start buying corporate bonds, with the aim of loosening financial conditions and providing a stimulus to the economy as we work through the uncertain Brexit process and outcome, low corporate bond breakevens are to be expected. But with Treasury yields at extreme high levels out of gilts, and with the Fed not buying government bonds or corporate bonds at the moment, my focus is firmly on the attractive relative valuation of the US corporate bond market.
I wrote ahead of the UK referendum that I felt front end index-linked bonds were a good way to play the uncertainty surrounding the result, given the fact that they have crucial non-binary hedge characteristics. Since the result, breakevens (i.e. the market’s expectation of future inflation) have behaved exactly as expected, rallying. The chart below shows how nominal yields have collapsed to record lows but real yields have fallen even further, meaning that 5-year breakevens have rallied since the result was announced. This is exceptionally strong relative performance for index-linked gilts.
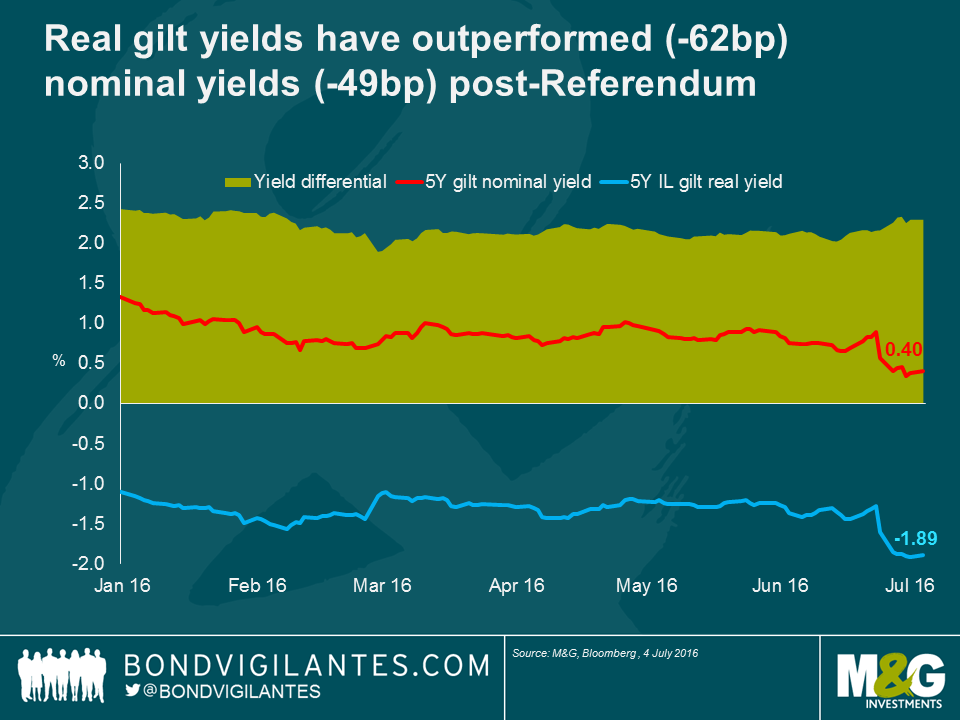
The major driver of this outperformance, which is all the more remarkable given it has occurred in an environment of falling nominal yields, has been an expectation of rising import inflation owing to sharp falls in sterling. On a trade-weighted basis, sterling is down around 9% since the referendum. The old rule of thumb that UK and Eurozone Economist at Scotiabank (aka inflation guru) Alan Clarke uses is that there is a 10:1 pass-through of sterling to inflation or, in other words, that a 10% fall in the pound will add 1% to inflation. When taken in light of this, the market’s response to the near 10% fall in the pound is not irrational, as a 20bp increase in inflation expectations in each of the next 5 years is pretty close to adding 1% to inflation compensation over that period of time.
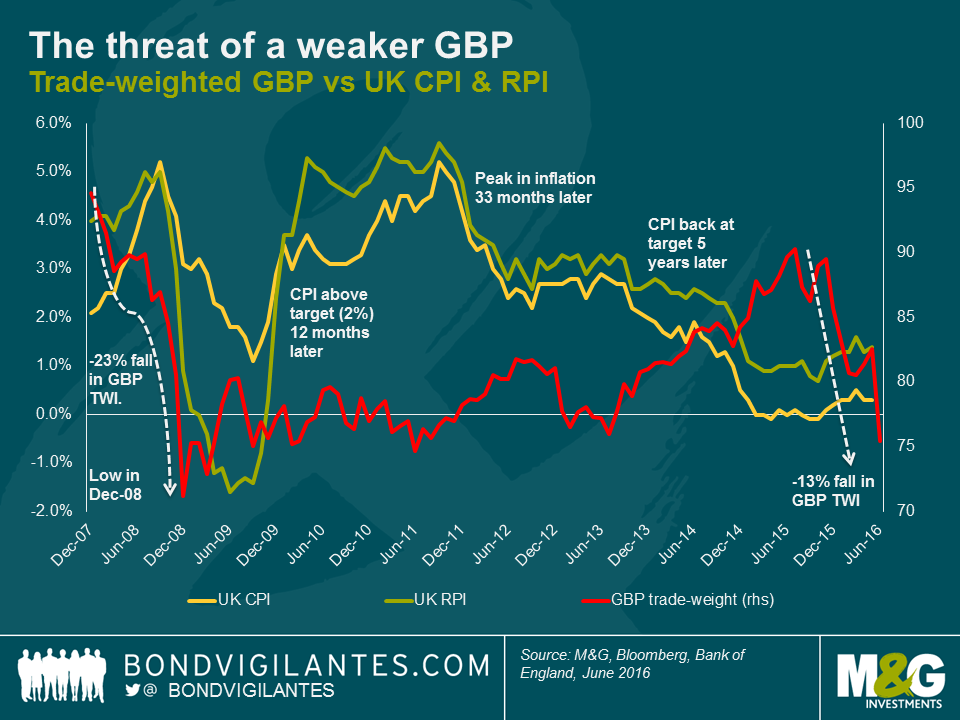
The above chart suggests that there is good reason for the market to look at the weakness of sterling and start to price in more inflation. Looking back at the global financial crisis, the pound weakened by 25% and, after a lag, RPI rose by more than 6%. This suggests that the scope for inflation expectations could have further to run.
Doing some simple calculations, a 6% inflation uplift after a 25% fall in sterling is closer to a 25% pass-through than to 10%. Indeed, Kristin Forbes of the Bank of England told markets last year that the BoE estimates a 20% to 30% pass-through from the exchange rate to CPI. This could mean that the 9% fall in the pound since the vote could bring a 2% increase in inflation over the short term. It is also important to point out that sterling has been on the slide for almost exactly 12 months now, over which time it has fallen by nearly 16%. Some of this weakness will start to show through in inflation imminently (given a 12 to 24 month time-lag). If we apply the experience following the financial crisis, and the Bank of England’s pass-through estimate, the UK might be on its way to seeing 3% to 5% higher inflation in the not too distant future.
At this point, it is important to acknowledge that there could be some downward pressure on UK inflation going forward. UK RPI includes around 15% to 20% of housing, made up of both house prices and mortgage interest payments. Mortgage interest payments now look even less likely to move upwards following the referendum, and you could convincingly argue they are more likely to fall now. House prices also look set for a fall, which means RPI will be dragged down. Perhaps more importantly, though, is that CPI does not contain these items, and so the wedge by which RPI is greater than CPI looks to me at this point to be set for a fall.
Besides the currency, there are other reasons that are making me positive on inflation-linked assets going into the second half of this year and into 2017. One is that we are nearing the point at which oil price moves will cease being a negative drag on inflation. January to April 2016 saw oil languishing below $40, so the first quarter of 2017 should see some strong positive contributions to inflation numbers, assuming commodity prices don’t plunge from current levels. In addition, the UK’s large and near record current account deficit could put further pressure on the already fragile pound. I expect these factors to outweigh and disinflationary impact from falling interest rates or house prices. As a result, even with the strong performance since the referendum result, I would continue to argue that there is still good value to be had in short dated index-linked bonds.
Over the last few days and weeks, as the odds of a vote to leave in the referendum have moved from a remote possibility to somewhat less so, market participants have spent more and more time wondering about how they are positioned going into the vote, relative to their benchmark, their peer group, or their risk budget. The significant moves that we have seen in recent trading sessions show pretty clearly that many were not content with their positions or risks going into the vote, as evidenced by a pretty clear period of volatility and risk aversion with selling of credit risk and a rally in government bonds.
Only a couple of weeks ago, the credit markets were frantically fighting to get hold of reasonable quantities of the significant amount of new issuance we were seeing from investment grade companies. A few weeks later, issuance has ceased and sellers of these much sought after bonds seem to be outnumbering buyers, given the back-up in credit spreads seen in recent sessions. The simple conclusion is that as the odds of Brexit rise, investors feel the need to reduce risk and are selling corporate bonds.
Playing devil’s advocate, let’s imagine that a portfolio manager has sold credit risk and raised cash ahead of next week’s vote. The portfolio manager is now feeling very satisfied at this moment in time as risk aversion has increased, resulting in a widening of credit spreads. However, the vote outcome is binary: either Britain votes to leave, or to remain. If the vote is to remain, then we can reasonably expect a significant retracement of the spread widening we have seen since fears of a leave vote rose.
If this proves correct then our imaginary portfolio manager is under-invested in credit and the credit risk that he or she sold will now need to be bought back, potentially at more expensive levels. Even if spreads did not rally in the event of a leave vote, then to replace the bonds that were sold, the portfolio manager will have to pay the prevailing bid-offer spread.
In other words, those selling credit risk now are predicting a vote to leave. This decision will benefit a bond portfolio as spreads rise, or as the leave probability increases, or if the leave vote were to occur (at least for a period of time, however long or short). But it does not work in the event of a vote to remain, and incurs costs on the bond portfolio.
Now let’s think about what to do with our duration positioning going into the vote. This, in my opinion, is an even harder call to make than with credit. Which way will gilt yields move in the event of a leave vote? On the one hand, the period of economic uncertainty that would result could see growth and inflation fall, which would argue clearly in favour of further falls in government bond yields. On the other, international investors currently own more than a third of the gilt market. What if these investors decide they no longer want to own sterling, or to own the same amount of sterling? Whilst my hunch is that the knee-jerk immediate response to Brexit would be for sterling to weaken and for gilt yields to rally further, how long would these moves last? Could we end the day with higher gilt yields and no change in the pound? Either way, the direction of travel of gilt yields is highly uncertain to me, which makes hedging or positioning duration for the referendum a very tricky call.
In my opinion, owning short dated breakevens is the most prudent way to go into the vote from the perspective of duration positioning. Firstly, if you believe that the currency is likely to weaken then you should own exposure to inflation linked bonds that will, especially at the front end, see higher inflation expectations from import inflation. This will support index linked valuations relative to nominal bonds. In other words, front end breakevens are likely to rise if sterling weakens. Secondly, putting the currency to one side for a moment, if yields rise (either on a leave vote as foreign sellers of gilts emerge or on a remain as risk appetite recovers and rate hikes are brought forward), then one would typically expect breakevens to rise. In this scenario, index linked bonds also outperform nominal bonds.
If yields fall on the other hand, a scenario most likely to happen in the event of a vote to leave due to risk aversion, then whilst typically breakevens fall, and so index linked bonds are underperforming nominal ones, at least owning breakevens means having a pretty decent link to nominal yields. It is difficult to create a scenario in which nominal yields rally strongly following a leave vote and index linked bonds fall in price (this scenario would be one in which inflation fears aggressively collapse, so it is not impossible, but it is unlikely).
So I believe that given the binary nature of the result, in which we are either in or out (what odds on 50:50, and what happens then?), the best way to be positioned in terms of duration ahead of the vote, outcome and aftermath is to own short-dated inflation linked bonds. It is not binary, as whilst owning breakevens means you are positioned for higher inflation, if breakevens fall following the vote and nominal yields fall, you are still linked to nominal yields and are likely to see the price of your bonds rise.
If the currency weakens after the election result, then import price inflation will lead to rising inflation expectations. And if the currency doesn’t weaken following the result, it has still been on a downward trajectory since last November which is yet to feed through into RPI, and the ugly current account deficit suggests on a medium term, fundamental basis, that there is more weakness ahead for sterling.
Finally, there are a number of reasons to choose front end index linked bonds. Firstly, front end breakevens are the cheapest on the curve. Secondly, the front end of the index linked curve is most likely to reflect inflation surprises and outcomes (such as oil base effects, sterling weakness, wage growth in the bonds’ prices); and lastly, because with gilt yields at all-time lows, it is prudent to keep interest rate risk at a relatively low level at this juncture.


Sign up to the Bond Vigilantes mailing list to ensure you never miss a great article from our expert Bloggers. We will email all new articles to your inbox, meaning you can stay on top of the world of Bonds.
I confirm that I would like to receive information about Bond Vigilantes and products and services from M&G Securities Limited.
We will use the email address and personal data you have shared with us to send you this information. For existing customers, submitting your contact details and requesting to receive this information from us, will replace any earlier choices you have made in respect of marketing information.
You can unsubscribe from marketing at any time, at which point we will not send any further marketing information to you, by selecting the unsubscribe link in all communications.